Cyber Threat Intelligence
Onboarding Documentation
Cyber Threat Intelligence
Onboarding Documentation
Indicator Match Rule is one of the detection rule types offered by Elastic. The general purpose of an indicator match rule is to create alerts when signatures of known threats are found within a subset of source events. Indicator Match Rules can be used across clusters with caution. Threat matching is an expensive operation and cluster performance degradations have been associated with indicator match rules in the past. Threat documents can be ingested from third party intelligence sources with package integrations through fleet threat intel modules, filebeat threatintel module, or other custom integrations.
There are a few rule parameters that are specific to indicator match rules.
| name | description |
|---|---|
threat_index |
indices queried to find indicator documents |
threat_query |
query made to find the indicator documents |
threat_mapping |
definition of which source event field values must match which indicator event field values, supports multiple fields as well as AND and OR combinations |
threat_filters |
filters applied to threat_query |
threat_language |
language of the threat_query |
threat_indicator_path |
object path of enrichment within a single indicator document |
concurrent_searches |
number of concurrent searches used during threat_query (defaults to 1, custom values currently unused) |
items_per_search |
number of items requested per threat query batch (defaults to 9000, custom values currently unused) |
percolate |
(experimental) boolean value to determine whether the percolateExecutor should be used. |
The Indicator Match rule type is created by registering a security rule type with the rule registry plugin on kibana startup. A new rule can then be instantiated through the Create Rule UI or an API call. Just like any other detection rule, continuous rule execution relies on the task manager through the alerting framework. Alerts generated by indicator match rules have threat.enrichment.* fields populated with data from the matching indicator documents.
The threat match executor is where the specific logic that belongs to an indicator match rule resides. Currently there are two separate executors, threatMatchExecutor and percolateExecutor (experimental).
With the assumption that customers have more source event documents than indicator documents, the operation starts by obtaining indicator documents in batches of 9000 that satisfy the threat_query. Found indicator documents are then converted into filters for querying the events index to obtain matching events. Any resulting event hits are then enriched with the respective threats (facilitated by the identifiers baked into the named query, indicators must be requested again for threat.indicator.* fields), and are written to the alerts index with a bulkCreate operation.
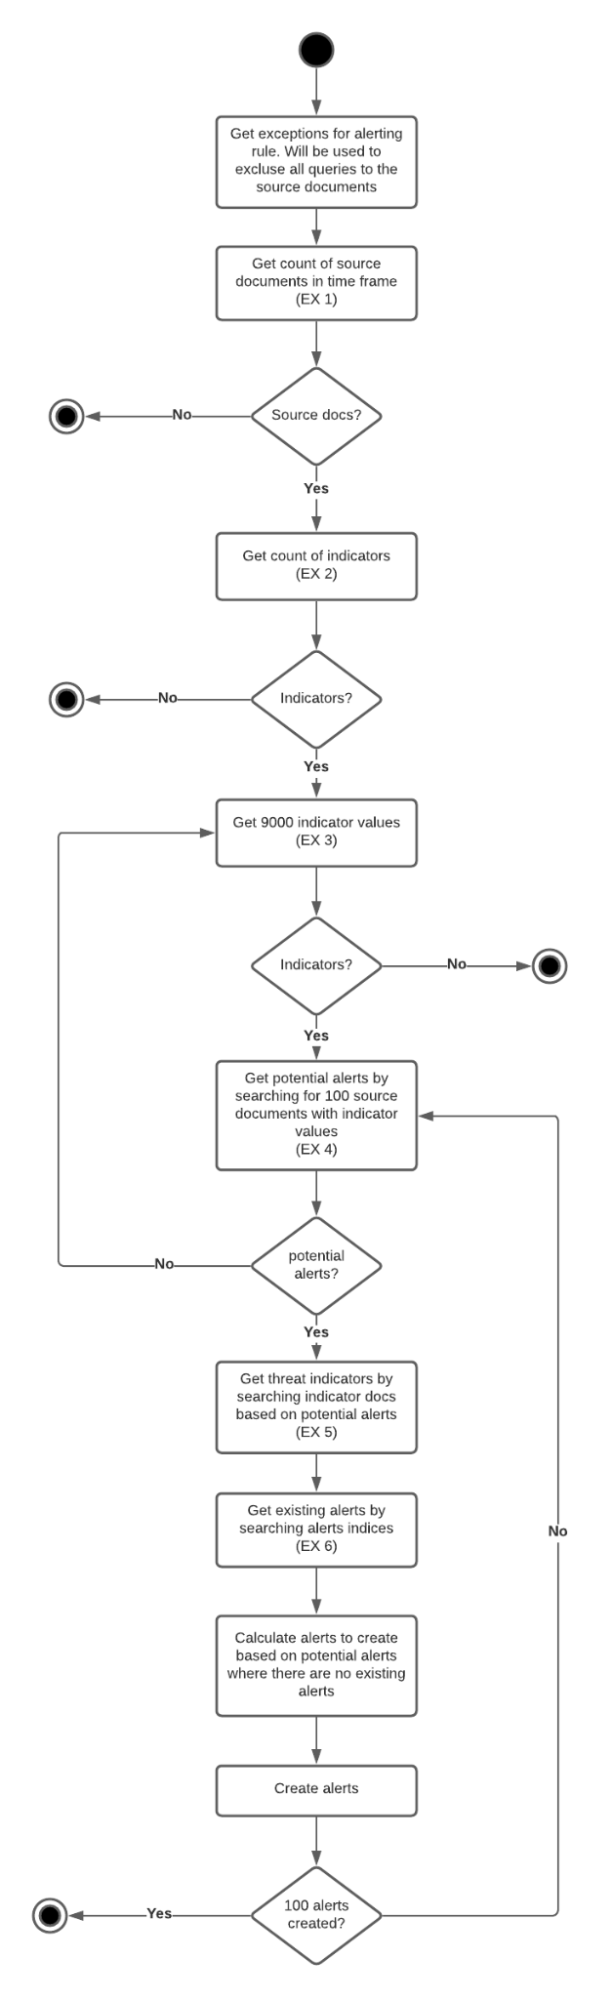
The assumption that the customers have more source event documents than indicator documents has been challenged in a number of SDH issues. To remediate, instead of obtaining indicators to convert them into queries for the events index, event counts and indicator counts are compared at the beginning of the rule execution, and the boolean filter implementation is then applied to the group of hits that has the smaller number of documents. If no documents are found with the count queries, the rule execution is skipped.
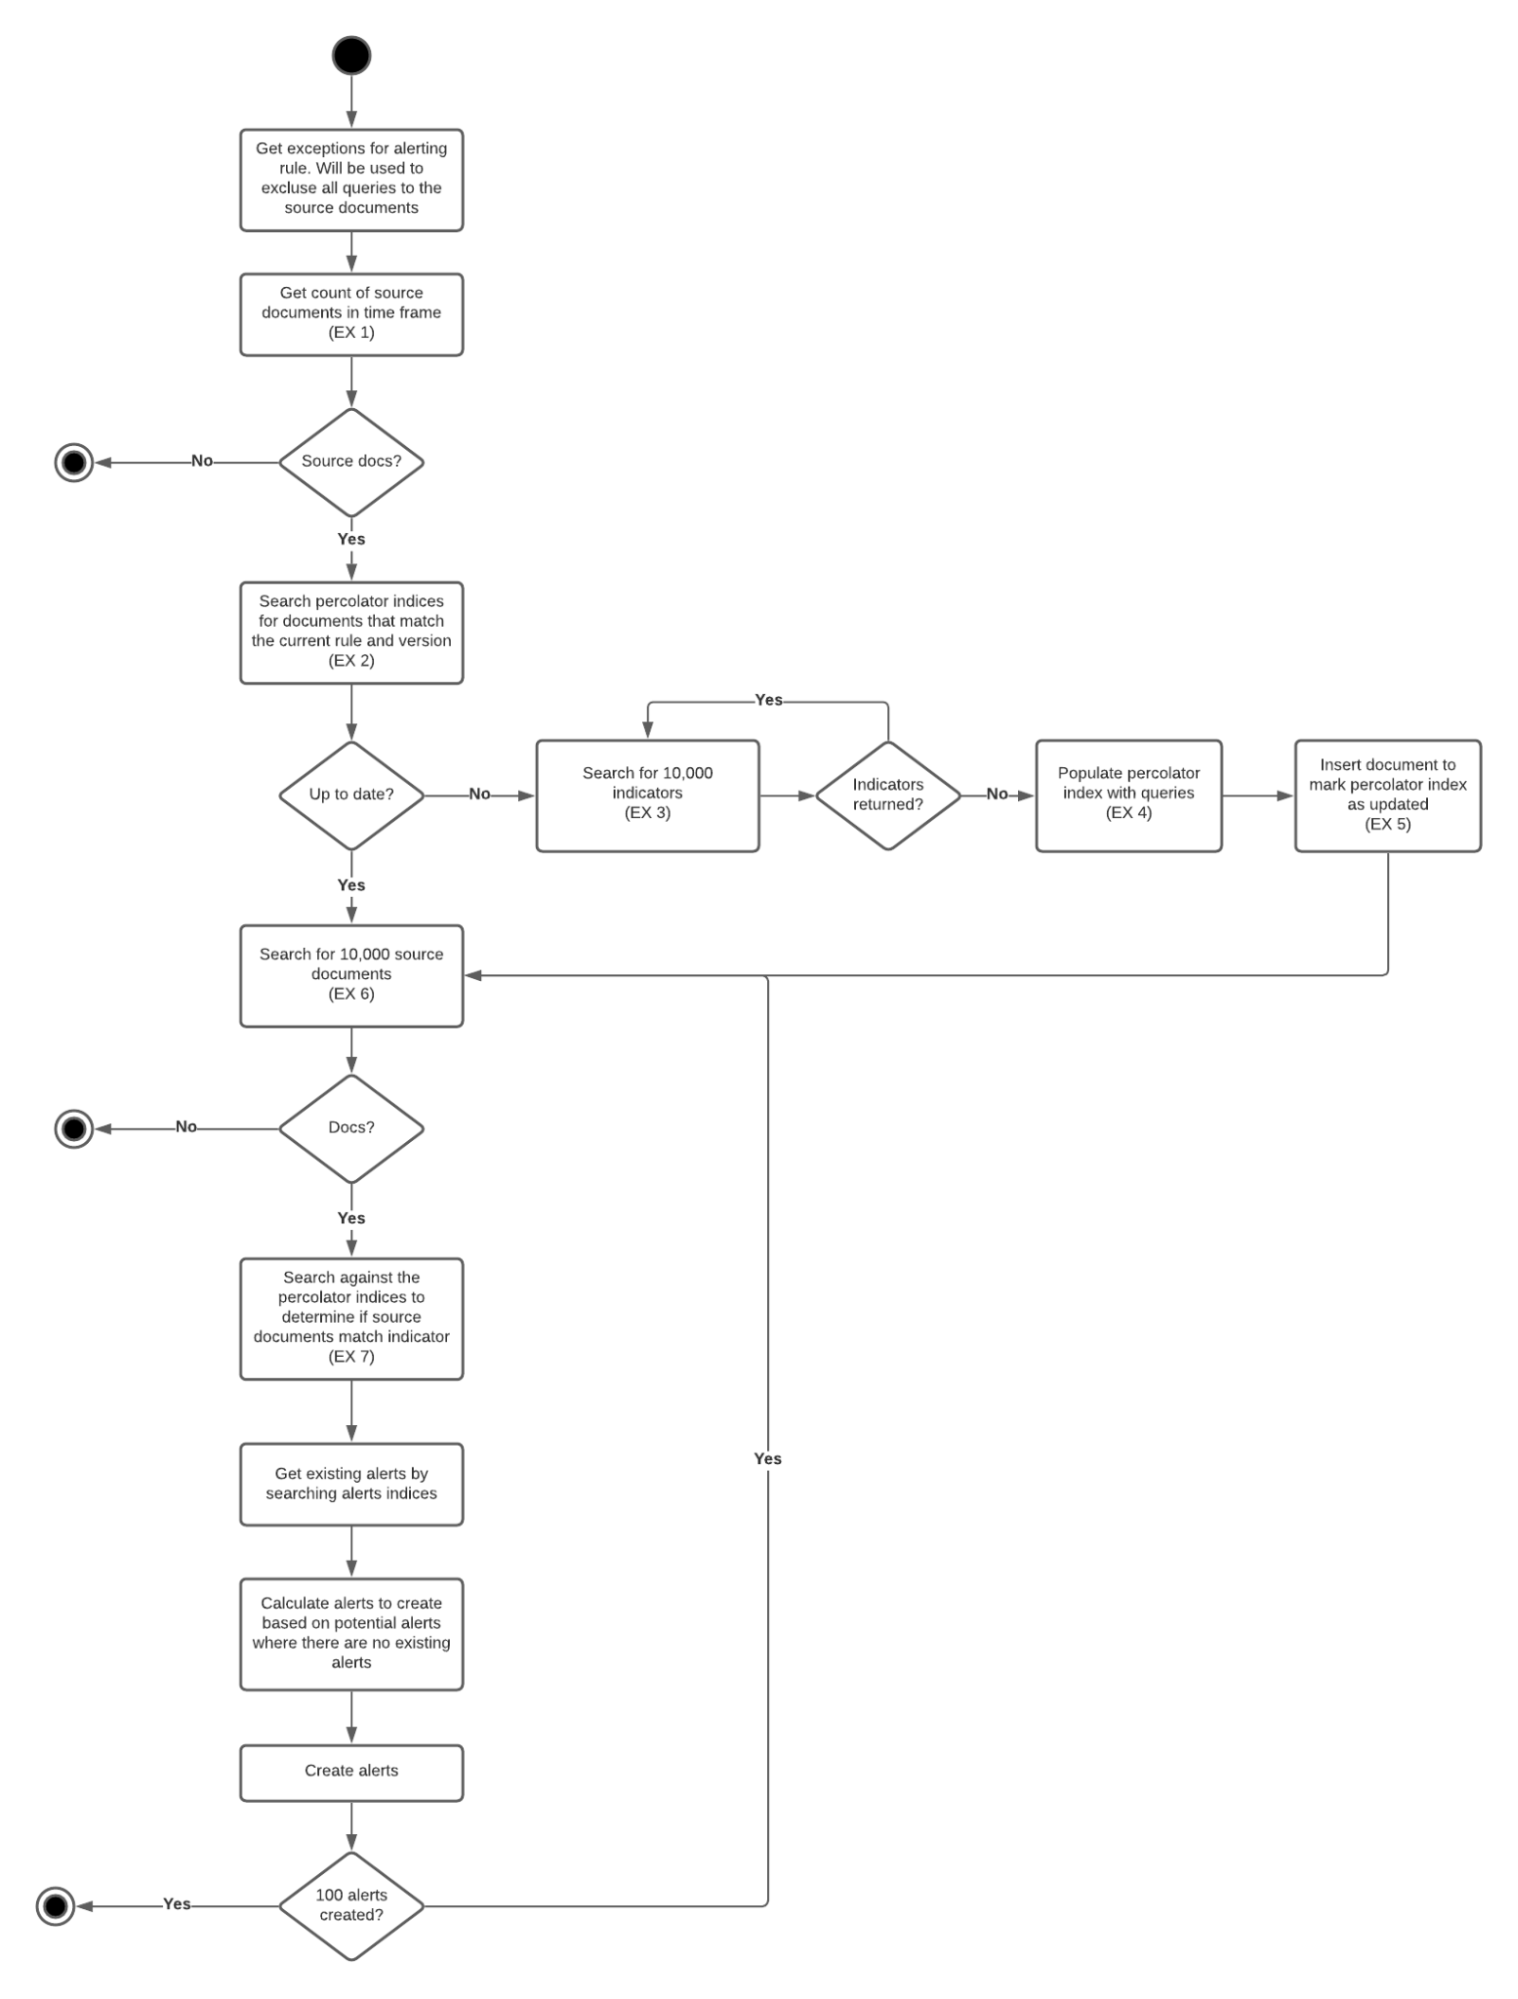
Percolator queries have been suggested for performance improvements as an alternate way of executing the rule.
Investigation time enrichments are pieces of information displayed as a part of an alert in the alert details flyout. Unlike threat match enrichments (placed onto alerts during the indicator match rule execution) investigation time enrichments are not persisted onto the alert. A search query looking for relevant indicators is triggered when the alert details flyout is opened with a click. The results of the query is displayed in the threat intel tab as an enrichment. Investigation time enrichments can be found on any alert (not just ones that are created by indicator match rules)
The following source event fields are matched against the following threat indicator fields found in the defaultThreatIndex Kibana UI setting. The detection engine or the alerting framework is not involved, only a custom search strategy is used to execute an elasticsearch query.
| source event field | indicator event field |
|---|---|
file.hash.md5 |
threat.indicator.file.hash.md5 |
file.hash.sha1 |
threat.indicator.file.hash.sha1 |
file.hash.sha256 |
threat.indicator.file.hash.sha256 |
file.pe.imphash |
threat.indicator.file.pe.imphash |
file.elf.telfhash |
threat.indicator.file.elf.telfhash |
file.hash.ssdeep |
threat.indicator.file.hash.ssdeep |
source.ip |
threat.indicator.ip |
destination.ip |
threat.indicator.ip |
url.full |
threat.indicator.url.full |
registry.path |
threat.indicator.registry.path |
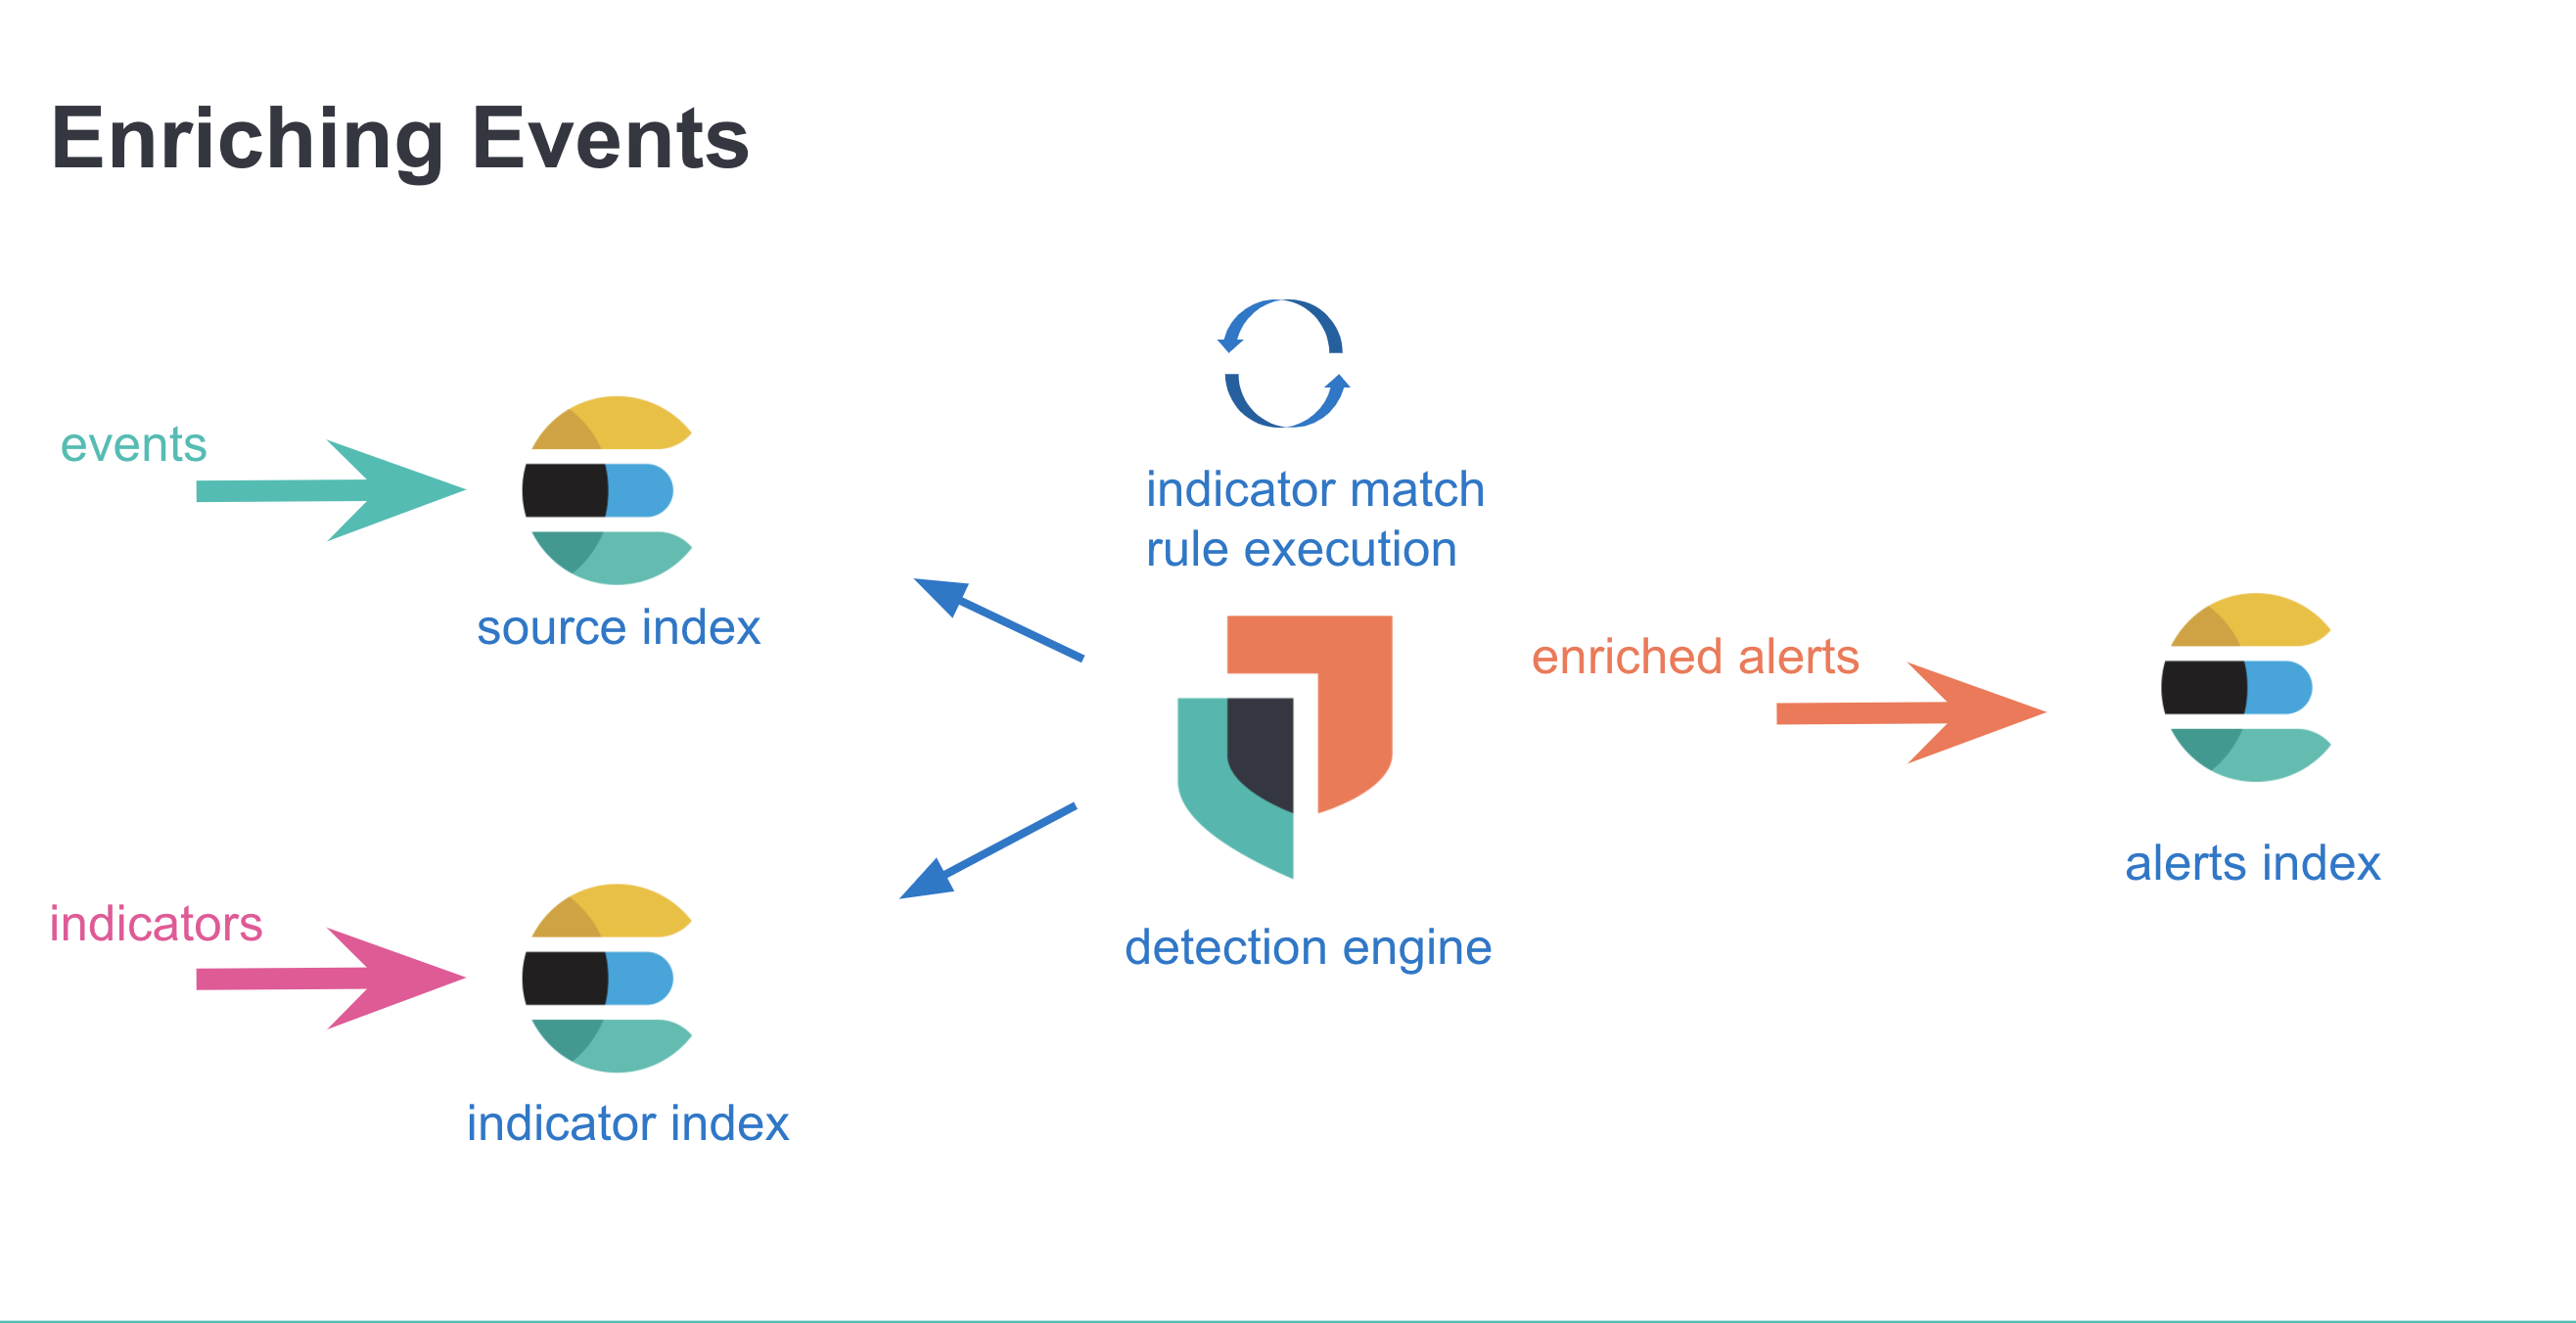
With indicator match rules, enrichments are made before the alerts are created, and they are persisted along with the alert.
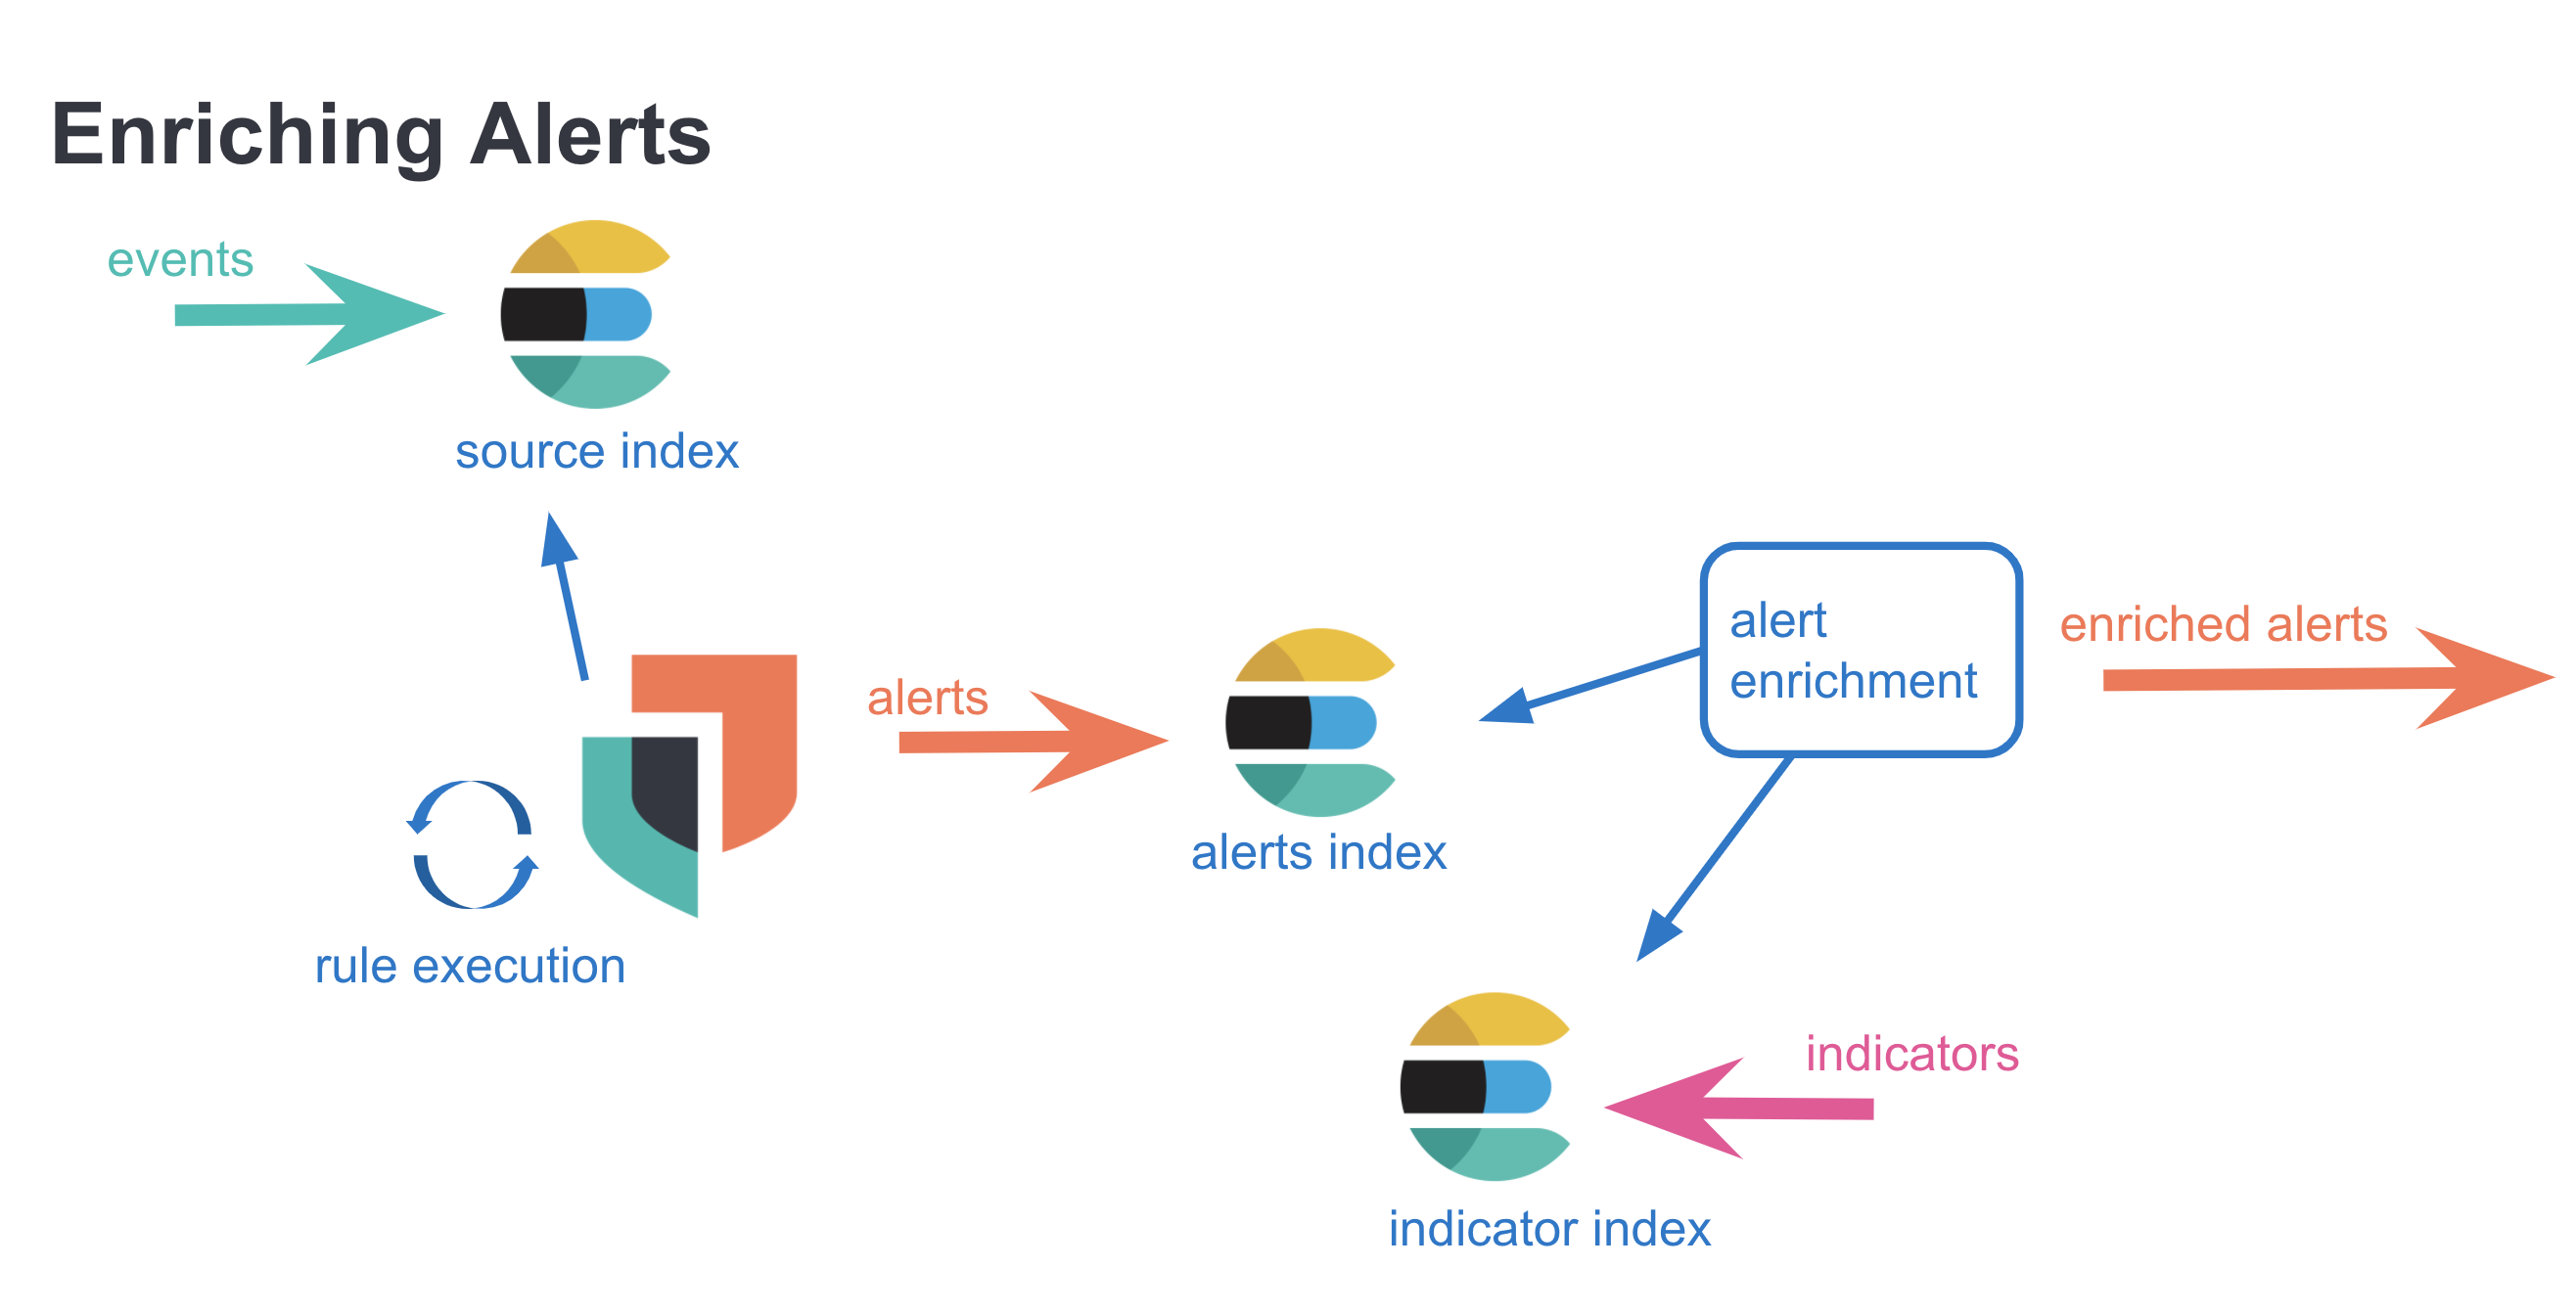
With investigation time enrichments, enrichments are done after the alert has been created, and the enrichments are not persisted.
ECS documentation is the source of truth for threat.* fields. An indicator document usually has many other fields such as agent.*, event.*, and more. For enrichment purposes however, threat.* fields are used exclusively. Specifically, when an indicator document is identified as matching a source event, the source event is enriched in the following manner: threat.indicator.* fields from the indicator are copied and placed in threat.enrichments array on the event, which is then persisted as an alert.
When the enrichment process takes place, a match object is created with the following values:
threat.enrichments.matched.id |
unique id of the indicator document on obtained from the threat index |
threat.enrichments.matched.index |
threat index where the indicator document is found |
threat.enrichments.matched.field |
the field on the indicator where the match has taken place |
threat.enrichments.matched.atomic |
the value of the matched field |
threat.enrichments.matched.type |
enum that shows how the enrichment is obtained, where values can be ‘indicator_match_rule’ or “investigation_time” |
threat.feed.* fields have metadata around the feed, we use threat.feed.name and threat.feed.dashboard_id to populate the UI in the CTI card.
threat_indicator_path is a rule parameter for the source path of the threat data, and it is used to override the default threat.indicator value during the enrichments process. This is especially useful as historically in filebeat 7* there were fields such as threatintel.indicator, which is the default value for then. We can easily override that, or any other place in any other index, with the threat indicator path. All threat data has to be in one place though, so even in a custom index, if there is file.hash.md5 under custom.test, and threat.indicator.path is custom.test, and there is file.hash.xyz under custom.test2, only the correct path one can be added onto the alert as the enrichment.
There is a number of constants used throughout the security solution with regards to CTI. this section explains the use of those constants and why the decision to use specific values have been made.
The detection engine generates only a specific number of alerts during a single rule execution. The default value is 100, which can be modified by setting the maxSignals parameter on the rule via the Create Rule / Patch Rule API. maxSignals parameter can not be set from the Create Rule UI.
When threat filters are getting constructed as a part of the boolean filter implementation within the threat match executor, indicators are obtained in batches of 9000. Elasticsearch documentation suggests no more than 10000 items per a single search, and encourages smaller sizes for better performance. 9000 has been chosen without performance testing, which means that there might be an opportunity for improvement here.
Multiple indices are specified by default as the value of this setting, and they are filled into the “index” input within the first step of the Create Rule UI. Left unchanged, these indices will be queried during the rule execution for source events.
Default threat index is provided by elastic to create an out-of-the-box experience for threat intelligence features in Elastic Security. With the 8.0 release, logs-ti_* index, which is the index pattern corresponding to fleet integration packages, is the default value. Prevously filebeat* has been used as the filebeat threatintel modules were the suggested way of obtaining threatintel in elastic. Default threat index value can be modified through the UI by going to Stack Management / Kibana Advanced Settings and searching for defaultThreatIndex.
Similar to the defaultIndex UI setting, the value of the defaultThreatIndex is used in the first step of the Create Rule UI, this time for filling out the value of the “indicator index” input. Additionally there are several other places where the defaultThreatIndex values are used as the source index for the indicator events, such as the CTI card on the Overview page, and the indices queried for investigation time enrichments.
Default indicator index query is hardcoded into kibana, with a value '@timestamp >= "now-30d/d"'. The specific purpose of this query is to ensure that by default, the indicator documents are limited to events that have been ingested within the past 30 days - since having a high number of indicator documents impacts rule execution performance negatively, and recency of indicator documents is an important factor in alert prioritization.
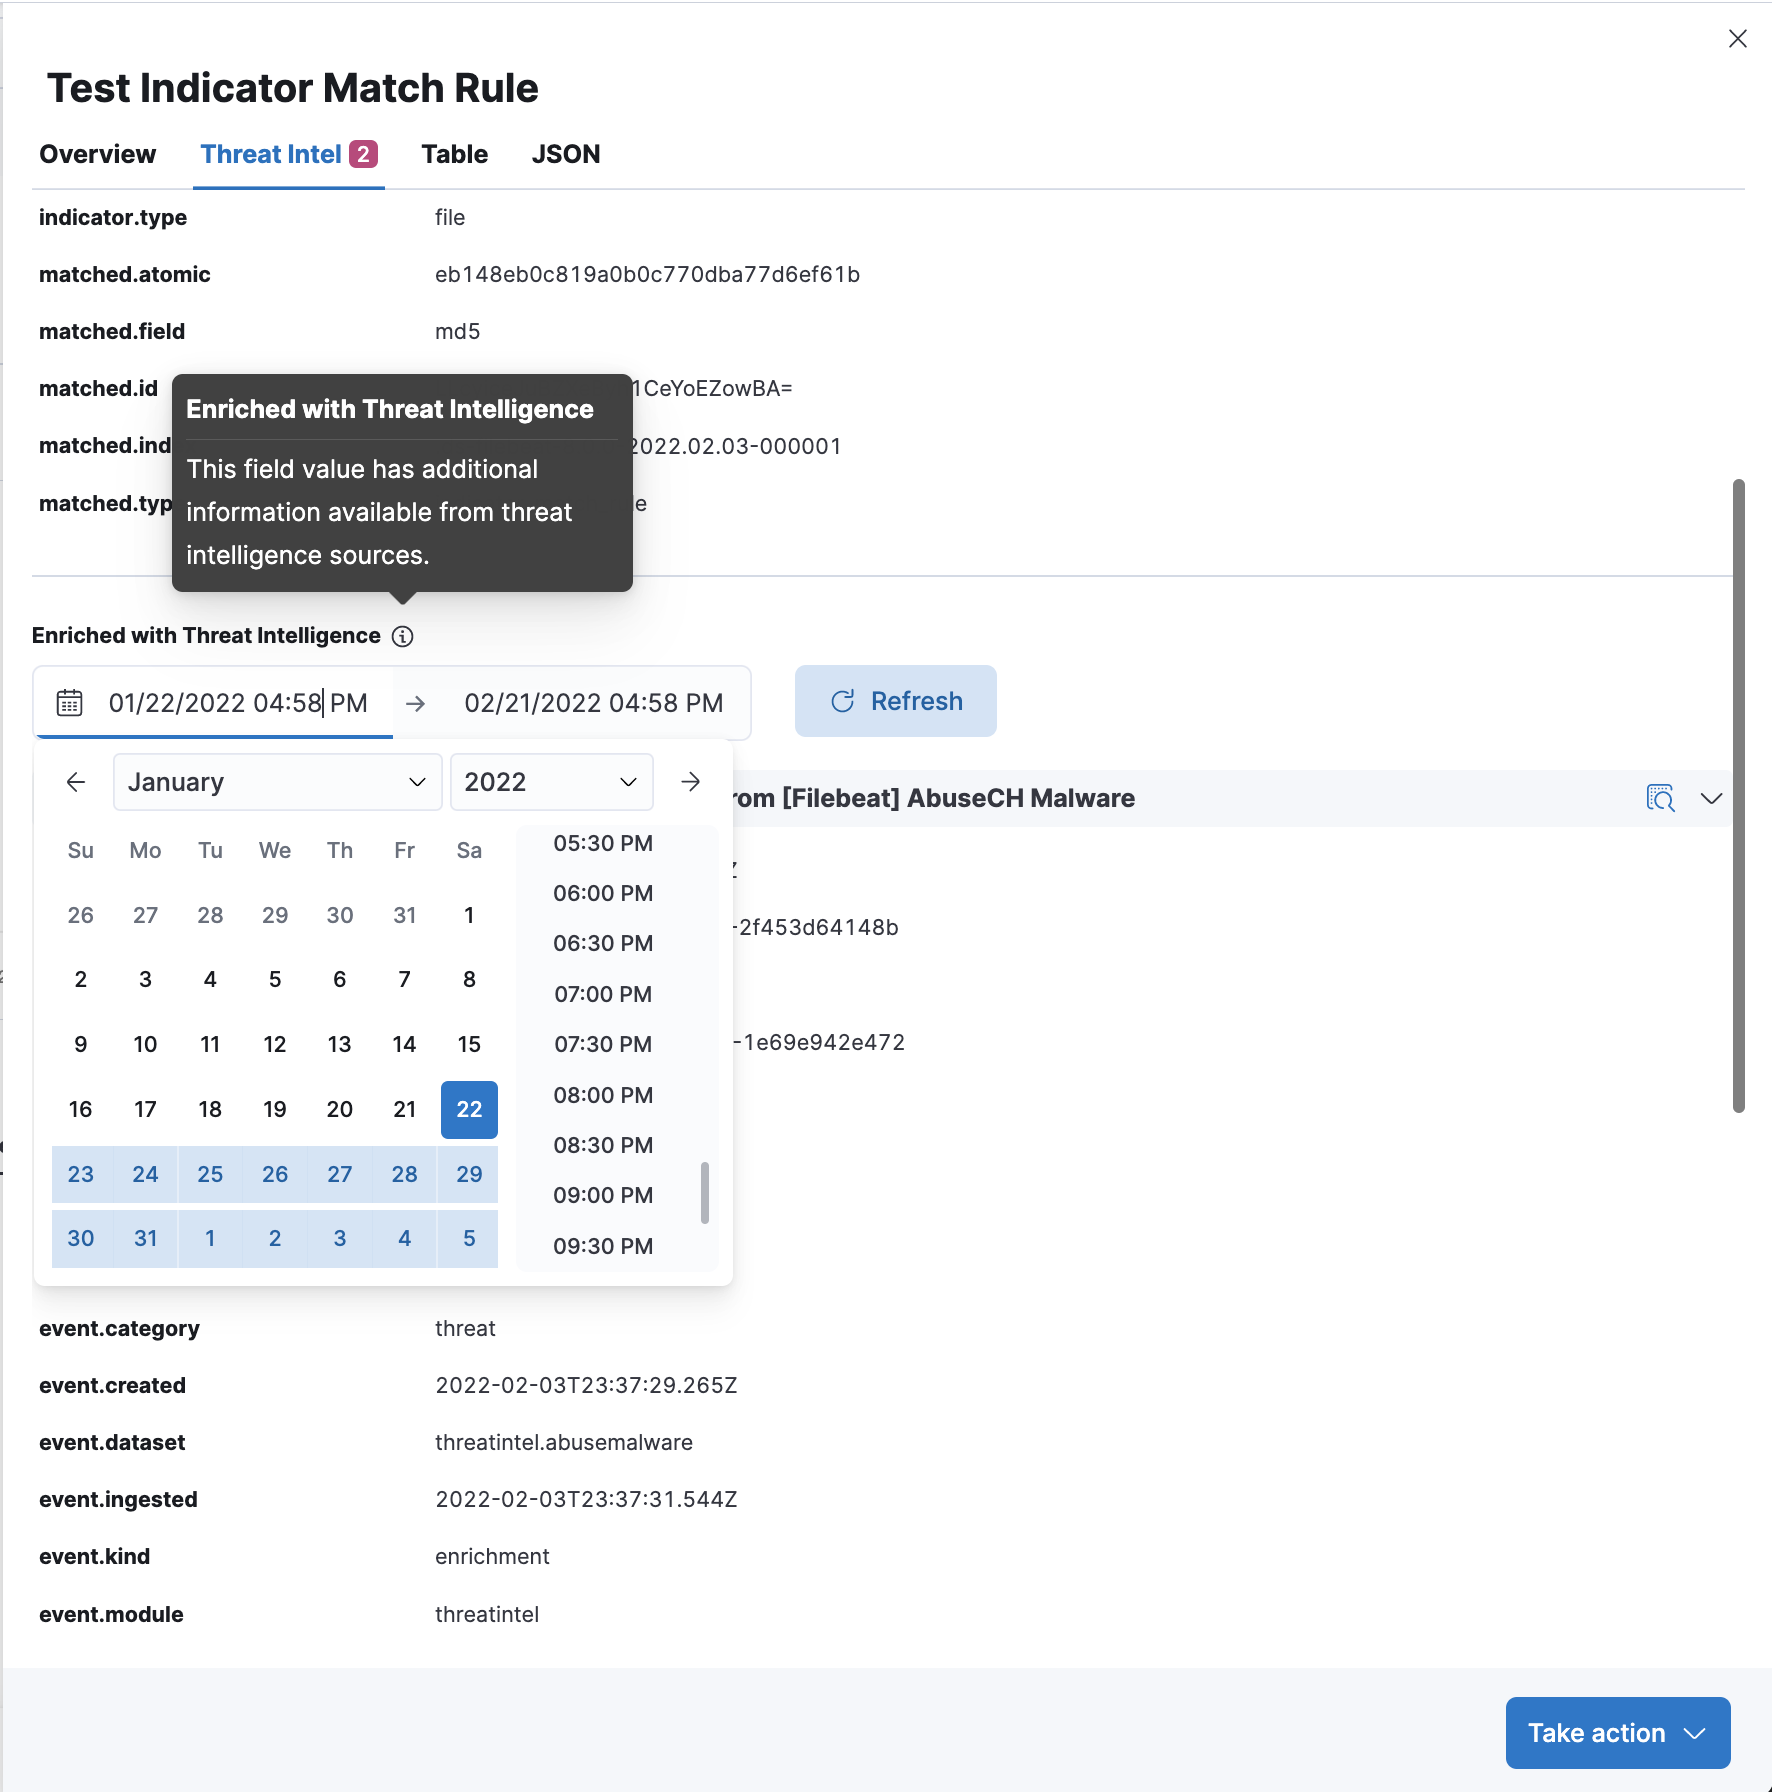
Investigation time enrichments also have concept around the 30 day lookup for the indicator documents. The indicator index query is not visible on the UI as an input field, but there is a Calendar UI that can be used to modify the lookback time for indicators, so an alert can be examined for investigation time enrichments for a specific campaign that may have taken place in the past, even if no investigation time enrichments show up on the alert for the specific -30d window.
Indicator match rule preview feature is created to ensure that an indicator match rule can be viewed through the preview UI as a part of the create rule flow define step. The most important part of the preview is to surface errors and warnings to the UI before the rule is created, so that if there are any issues with the rule configuration, the issues could be identified before the rule is actually created. In the future, warnings that are specific to indicator match rules (such as “too many events” or “too many indicators” to encourage the users to use the index query and threat query more effectively are considered.
The indicator match rule preview uses the threat match executor, and is thus a close approximation of the rule execution (as it is not a search strategy used to simulate the rule execution, but the rule execution itself). However, the alerting framework and the task manager are not a part of the preview implementation. Once a POST request is made to the detection/rules/preview endpoint is made with the appropriate parameters, the threat match executor is used with a preview specific rule data client where the alerts generated are written to a specific space-aware preview index and a unique preview id. The preview UI then queries the preview index with the preview id with a matrix histogram query and displays the results. The preview index has a special ILM policy where it rolls over every day and cleaned every other day.
Since the rule preview is placed at the very beginning of the UI (define step), a lot of the parameters that would could be defined in the later steps are not known by the time that the preview request is triggered. To enable the rule execution some of those required but missing parameters are supplied by default.
interval |
1h |
from |
5m |
threat_indicator_path |
threat.indicator |
| Advanced Settings | - |
Detection engine uses a concept called max_signals in general, which means that a single rule execution can only return up to a 100 alerts, and subsequent missing alerts would be picked up with the gap-detection strategy with the next rule execution. However, there is no gap detection strategy with the indicator match rule preview implementation as the rule execution is triggered only once, with the parameters listed above. Therefore indicator match rule can show a preview only up to a 100 alerts in a single preview.
threat_indicator_path is default as discussed in the parameters sections, which means that the threat matching can not happen with a custom indicator path, which means that preview won’t return results otherwise as the executor can’t go ahead with the enrichment step (should this be skipped for preview?)
Indicator match rules have been disabled at 8.0.0 as the single rule execution can take many seconds even with the most barebones implementation. There is no inherent mechanism to stop the rule execution if it starts taking a really long time, and it can clog up the system with no remediation strategy other than restarting the server if it starts hanging due to a huge query execution time. Given the circumstances the preview functionality has not been deemed production-ready at this time.
Prebuilt rules are built by the elastic protections team so that customers can start enabling it immediately and they can have an out of the box experience with threat intelligence in their platform. The rules are created with the latest information and the important techniques. Up until 7 there was only the filebeat rule, which have resulted in a lot of SDHs. In the 8 release we have opted to ship multiple rules so that they can be disabled at will if any of them start behaving badly.
This rule queries the logs_ti* index pattern to find indicators that have been ingested by Fleet threat intelligence packages.
This rule queries the filebeat-8* index pattern to find indicators that have been ingested by filebeat threatintel module. Filebeat 8.x is ECS 1.11 compliant, with threat.* fields.
This rule queries the filebeat-* index pattern to find indicators that have been ingested by filebeat threatintel module. Filebeat 7.x is not ECS 1.11 compliant, and has threatintel.* fields instead of threat.* fields. Therefore, threat_indicator_path is set as threatintel.indicator in the rule configuration.
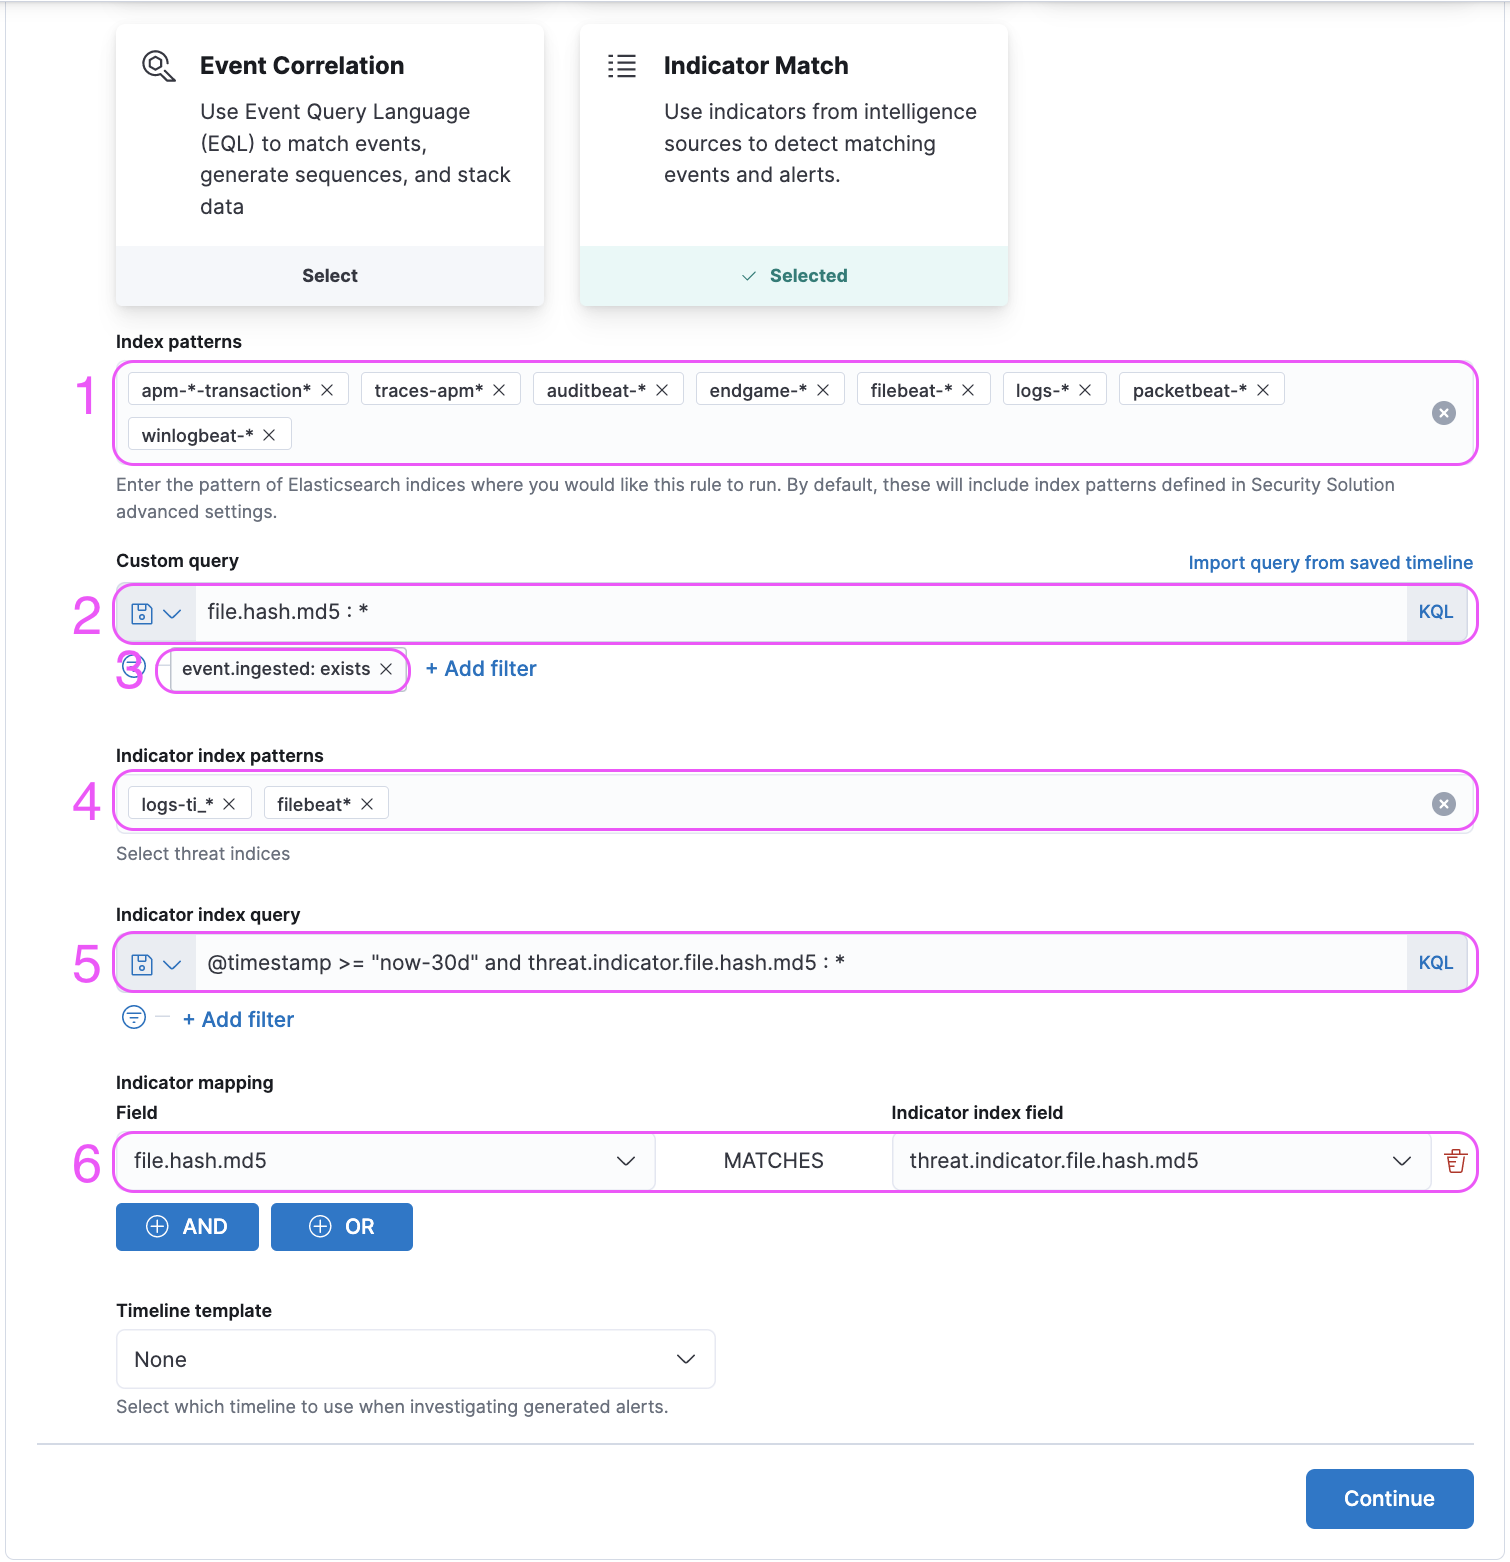
index <-> Source events are queried from the indices specified with this parameter.query <-> Source events are queried with the query specified with this parameter.filters <-> Source events are filtered with the filters specified with this parameter.threat_index <-> Indicator events are queried from the indices specified with this parameter.threat_query <-> Indicator events are queried with the query specified with this parameter.threat_mapping <-> Source events and Indicator events are matched on the values specified with this parameter. Multiple mappings can be added with AND and OR buttons.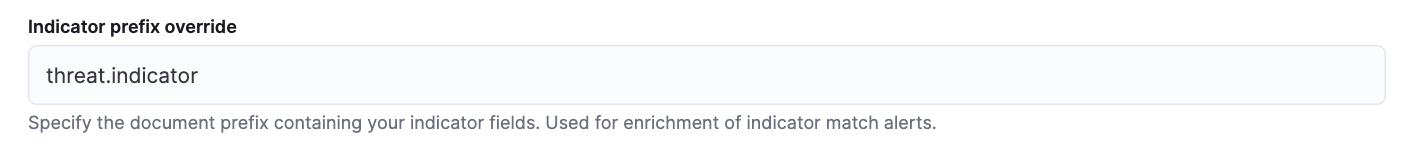 In the advanced settings section, the value of the
 threat_indicator_path parameter can be set on the input titled “Indicator prefix override”. The default value threat.indicator is ECS 1.11 compliant.
 The default value for the
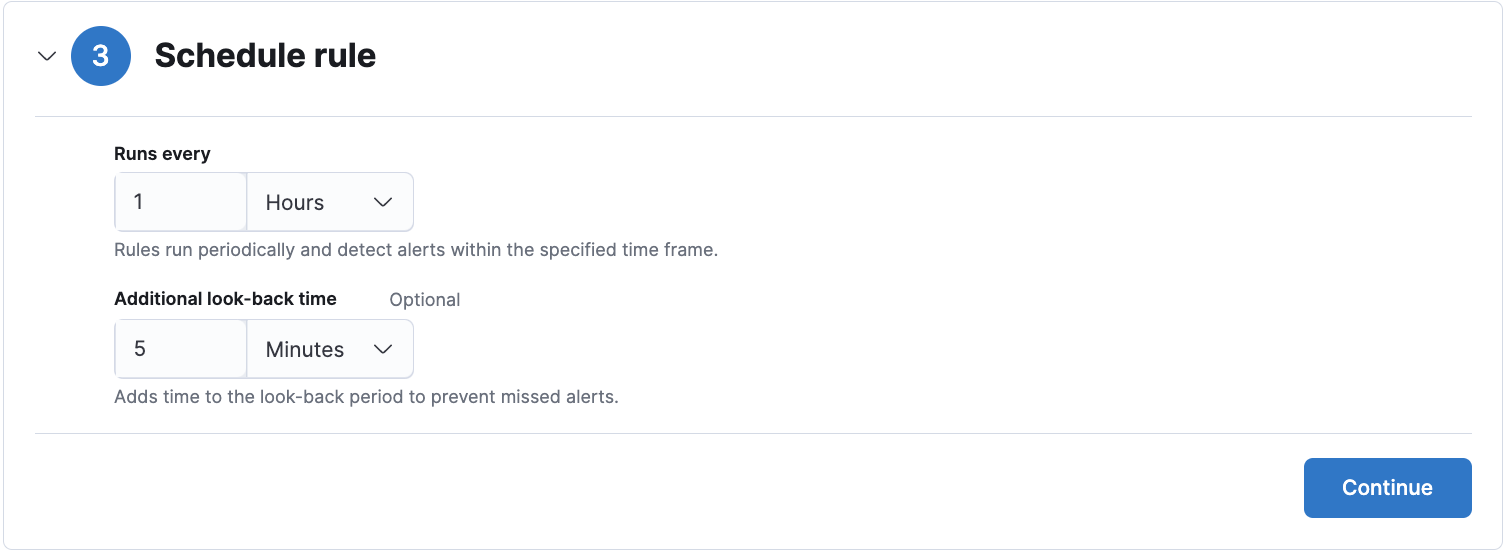
 schedule parameter is 1h for indicator match rules, and it is recommended to customers not to make the rule execution more frequent to avoid overloading kibana memory.
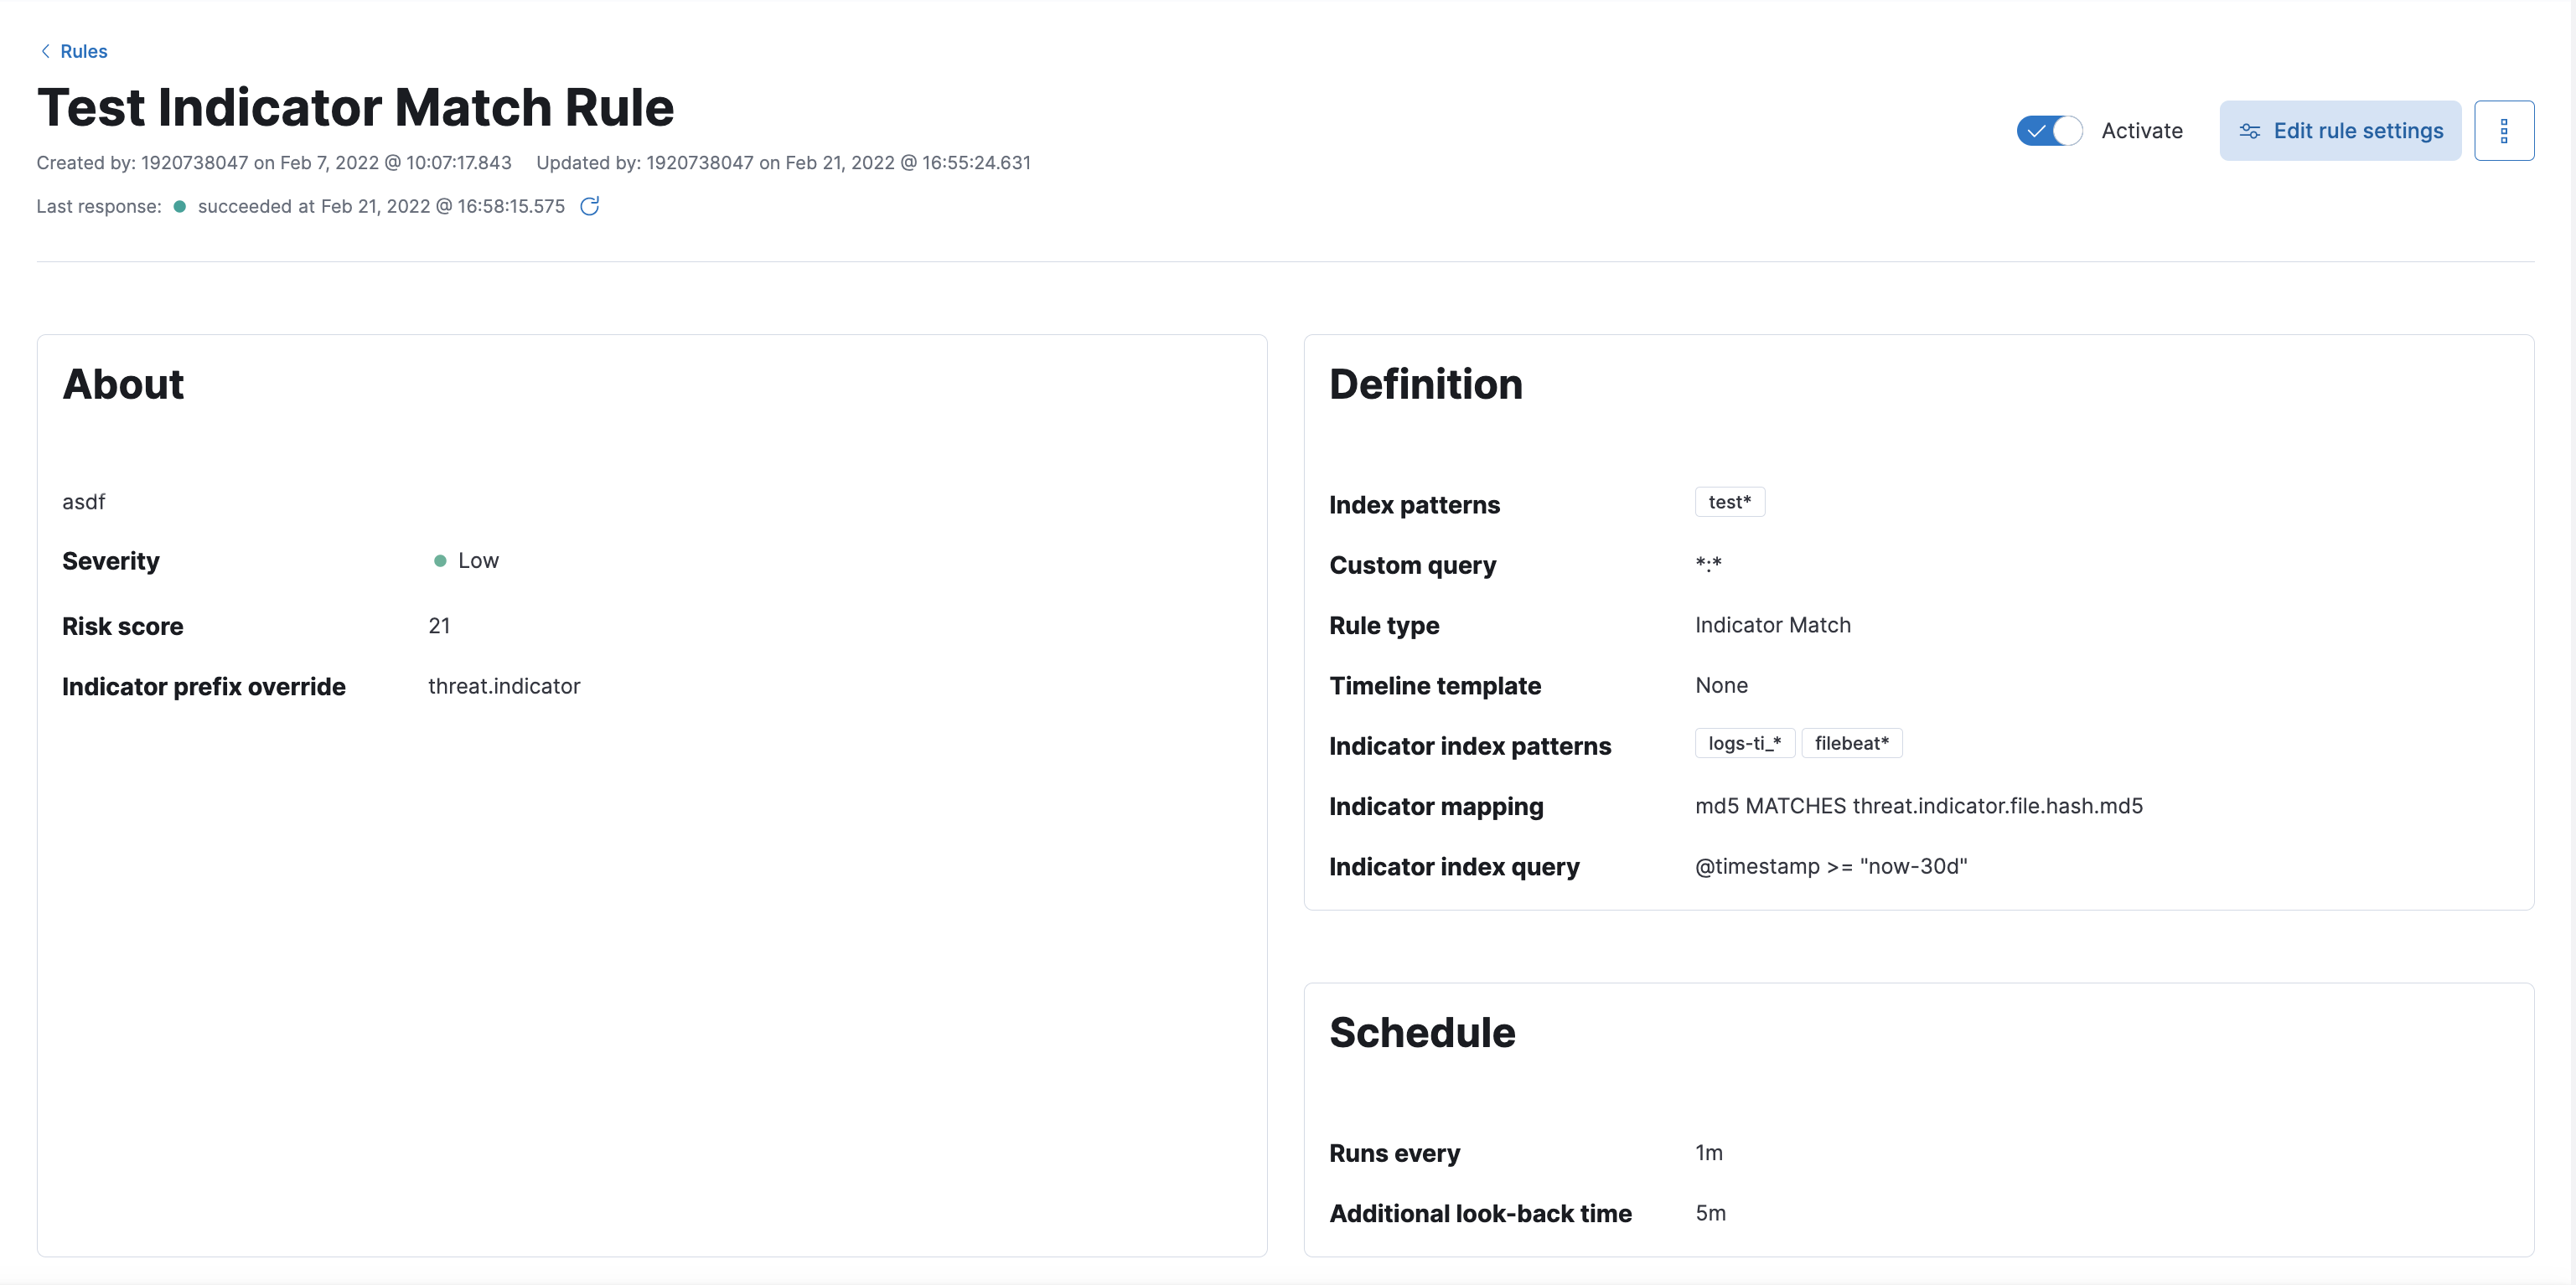 You can find information about the rule parameters in the rule details UI.
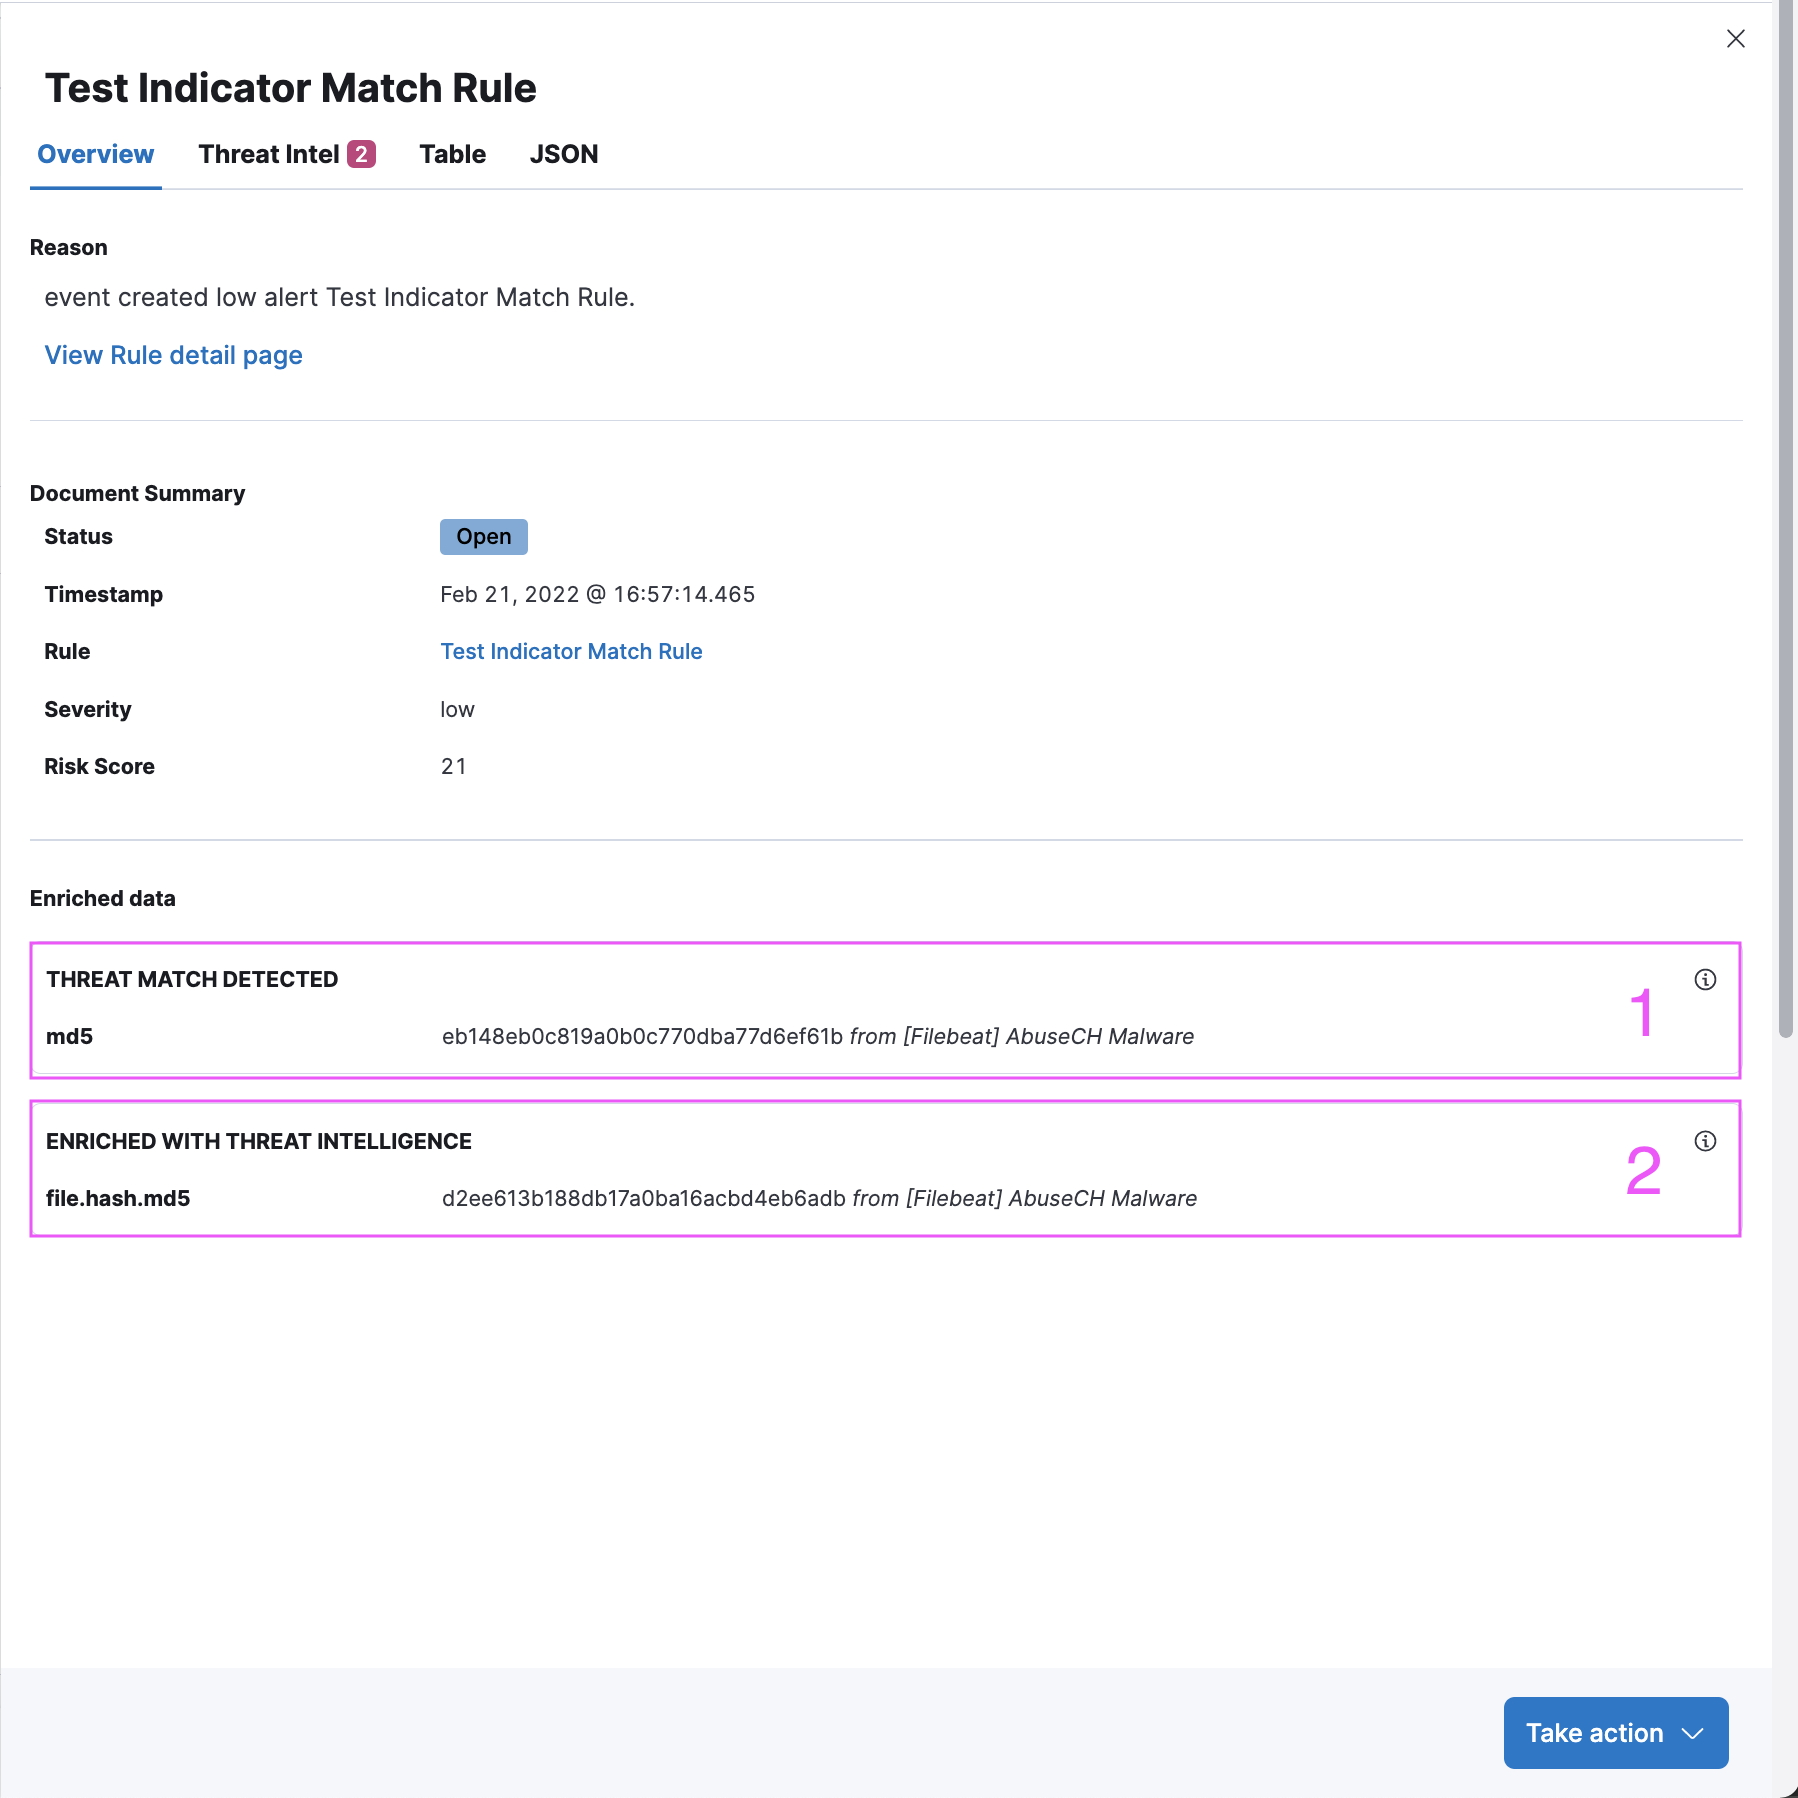
Threat Intel tab shows each threat intelligence enrichment associated with the alert.
Enrichments added by the indicator match rule are under the “Threat Match Detected” section. Each enrichment can be collapsed / expanded by clicking on the enrichment title.
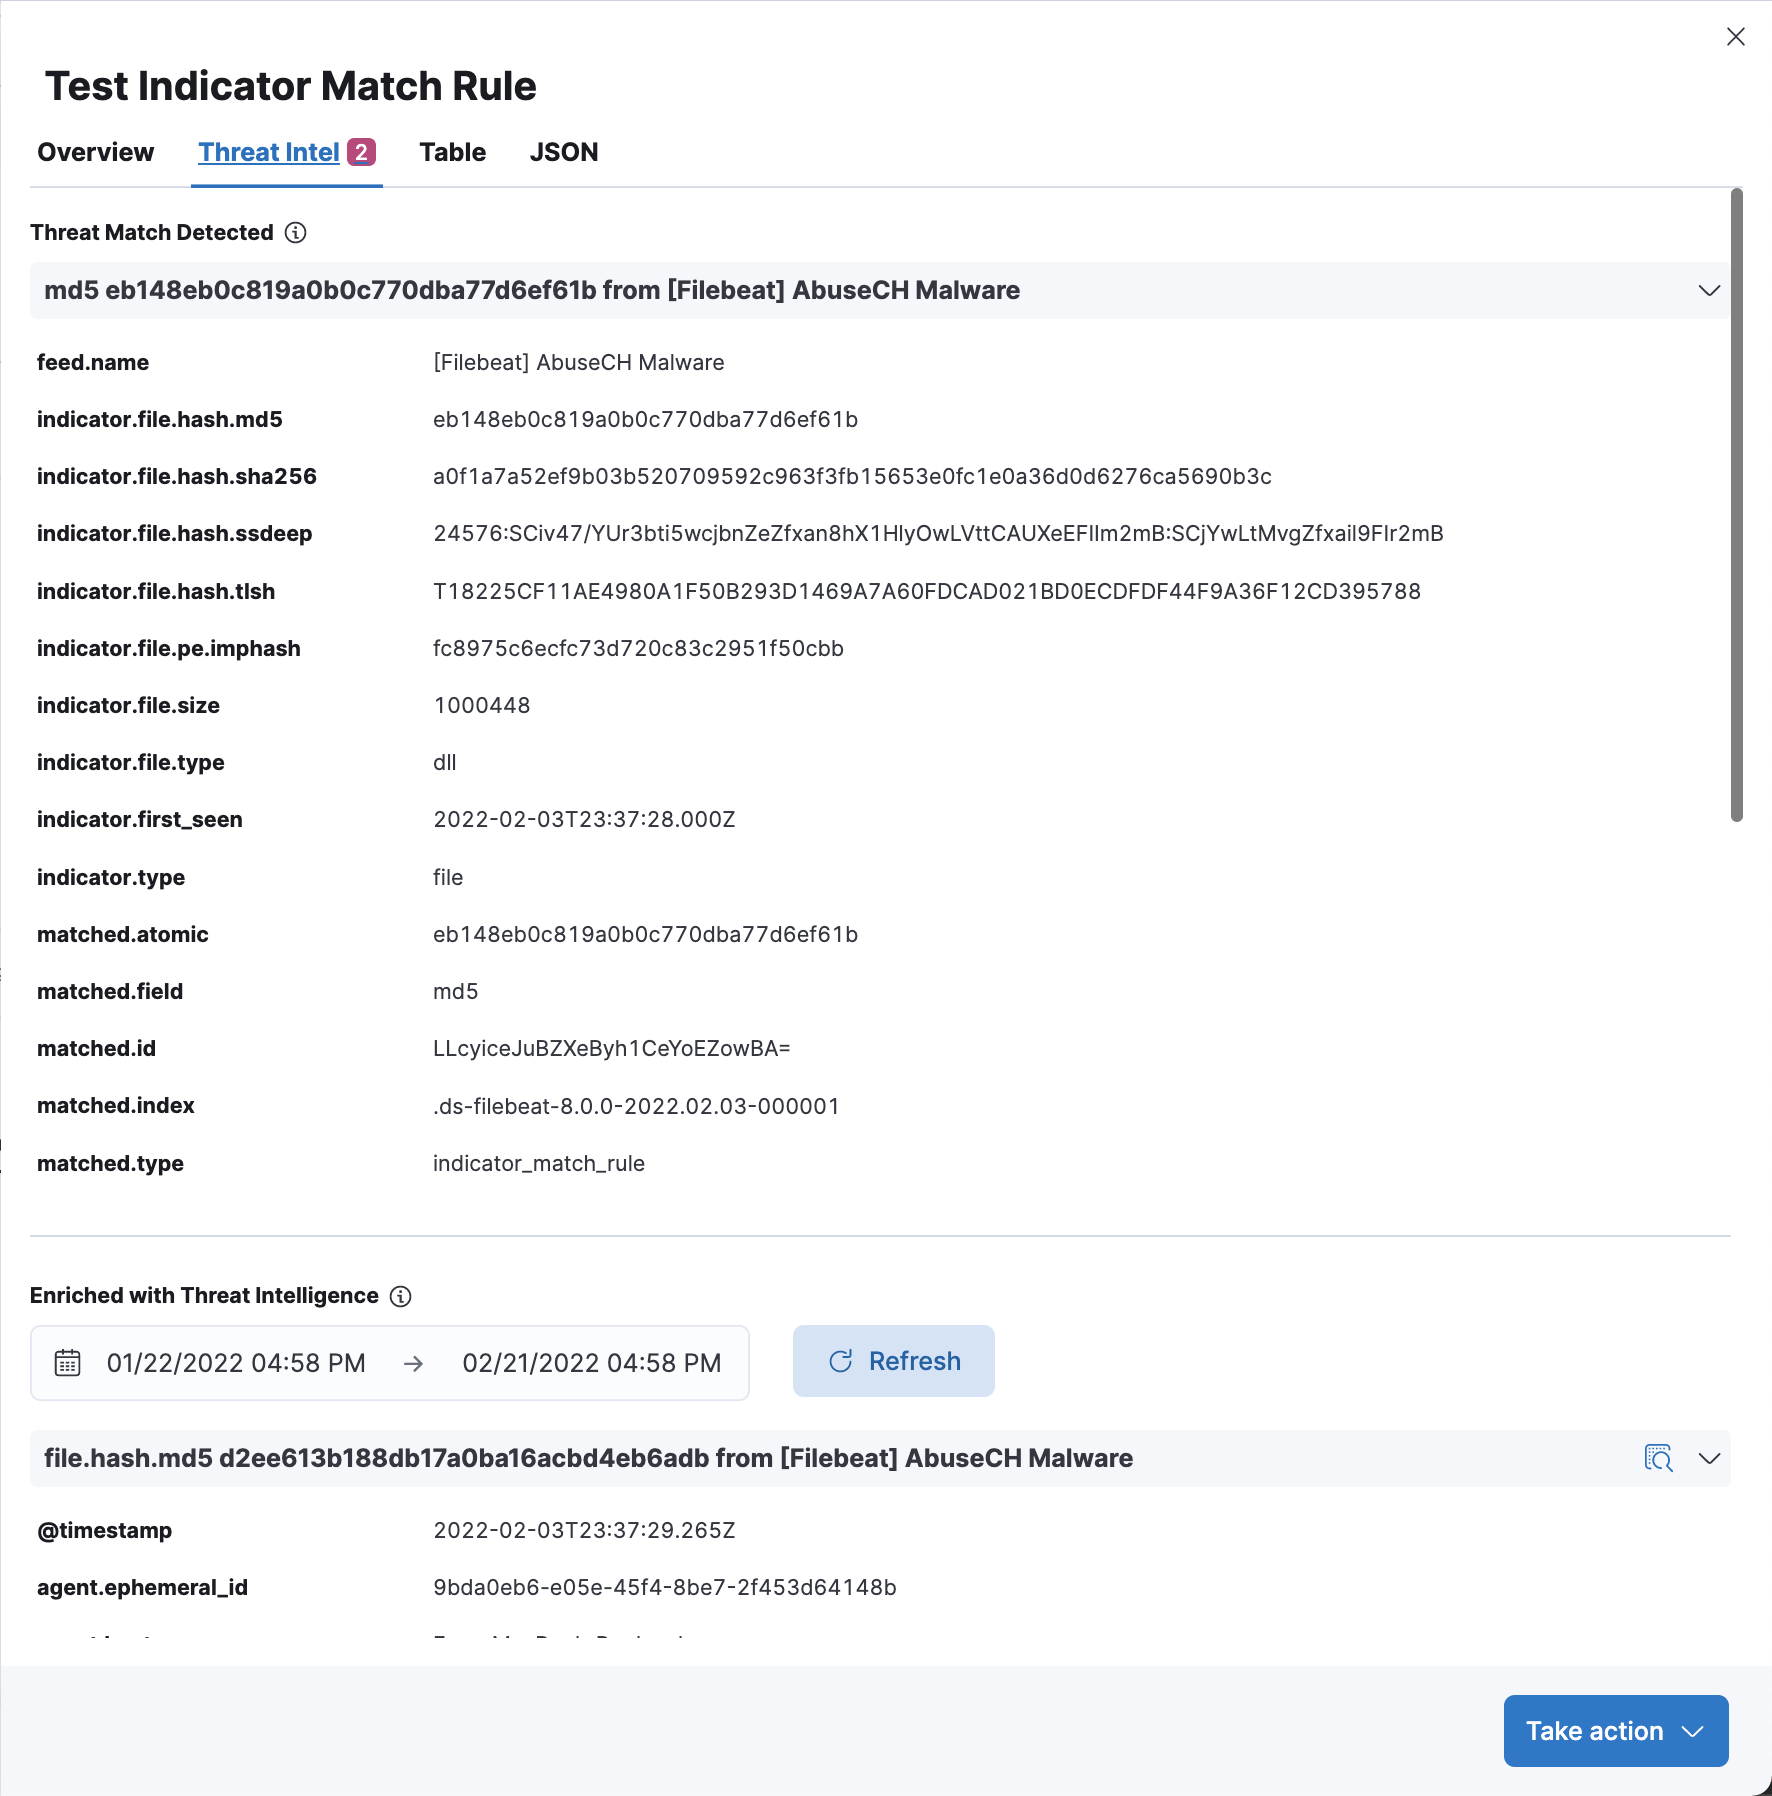
Enrichments added by Investigation Time enrichment logic can be found under the calendar view. The calendar defaults to a 30 day lookup, which can be modified to change the indicator lookup date.
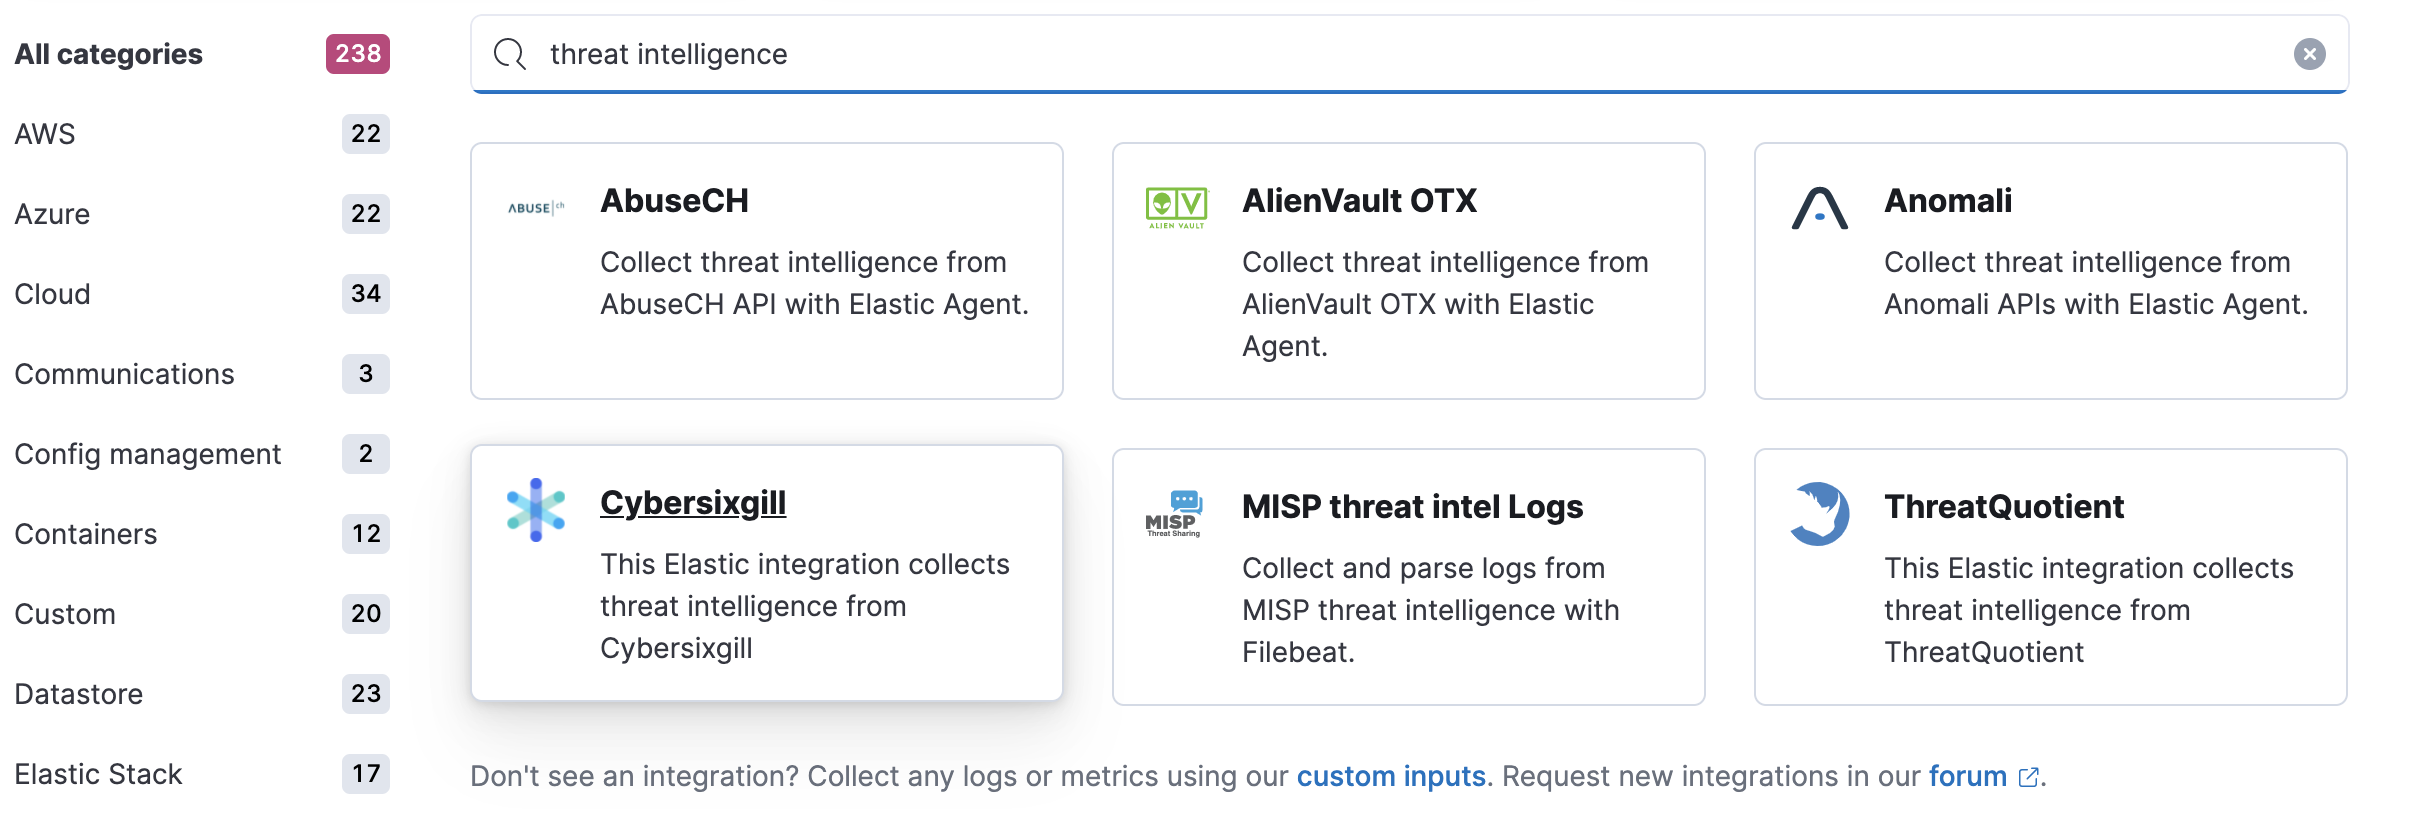
Threat intelligence integrations offered by Fleet can be found on the Integrations page in Kibana. Searching “threat” keyword will yield available threat intel integrations. Fleet Agent must be enabled for ensuring that the indicator events can be ingested. The integrations will populate indices starting with the prefix logs_ti-*, which is the default defaultThreatIndex UI setting value from v8.0 onwards.
The Threat Intelligence Card is on the Overview page, and it gives information about the status of the added threat integrations in terms of the indicator events that have been ingested by each integration over the course of the time that has been specified in the top level calendar of the security application. By default, the Fleet integration API is queried to see if all threat intel integrations have been added via fleet, and if not, a notification is shown to customers to facilitate discovery. The button on the notification takes the users to the Integrations page where the search query “threat” has been applied on the page. defaultThreatIndex UI Setting is queried to find the indicator counts, as it can be inspected with the “Inspect Query” button on the CTI card. threat.feed.name value is used to display the feed name on the UI. For non-ECS compliant data, “Other” is used for a combined indicator count.
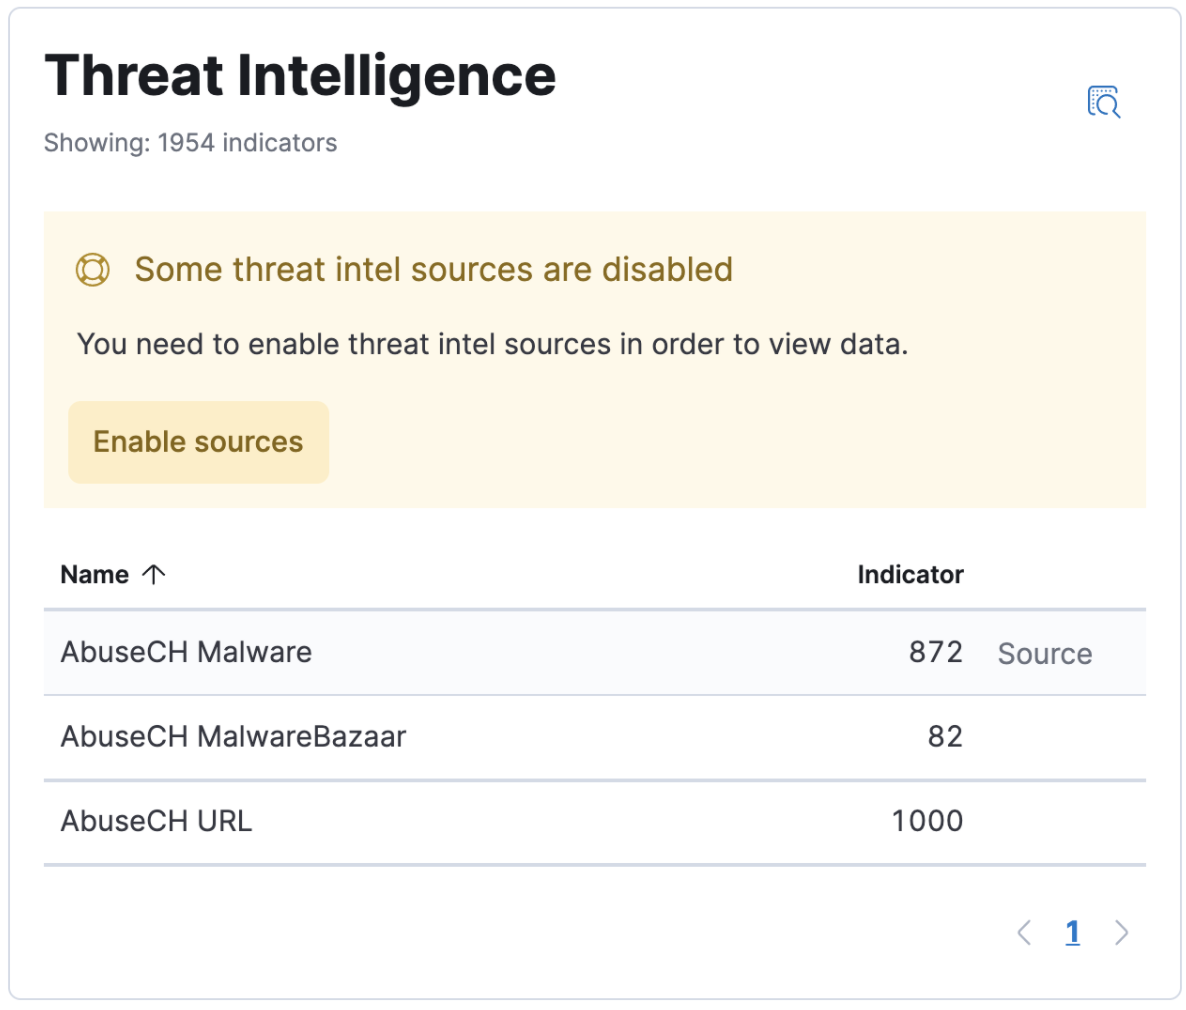
Threat intelligence dashboards links can be found on the Threat Intelligence Card, in the column titled “Source”.
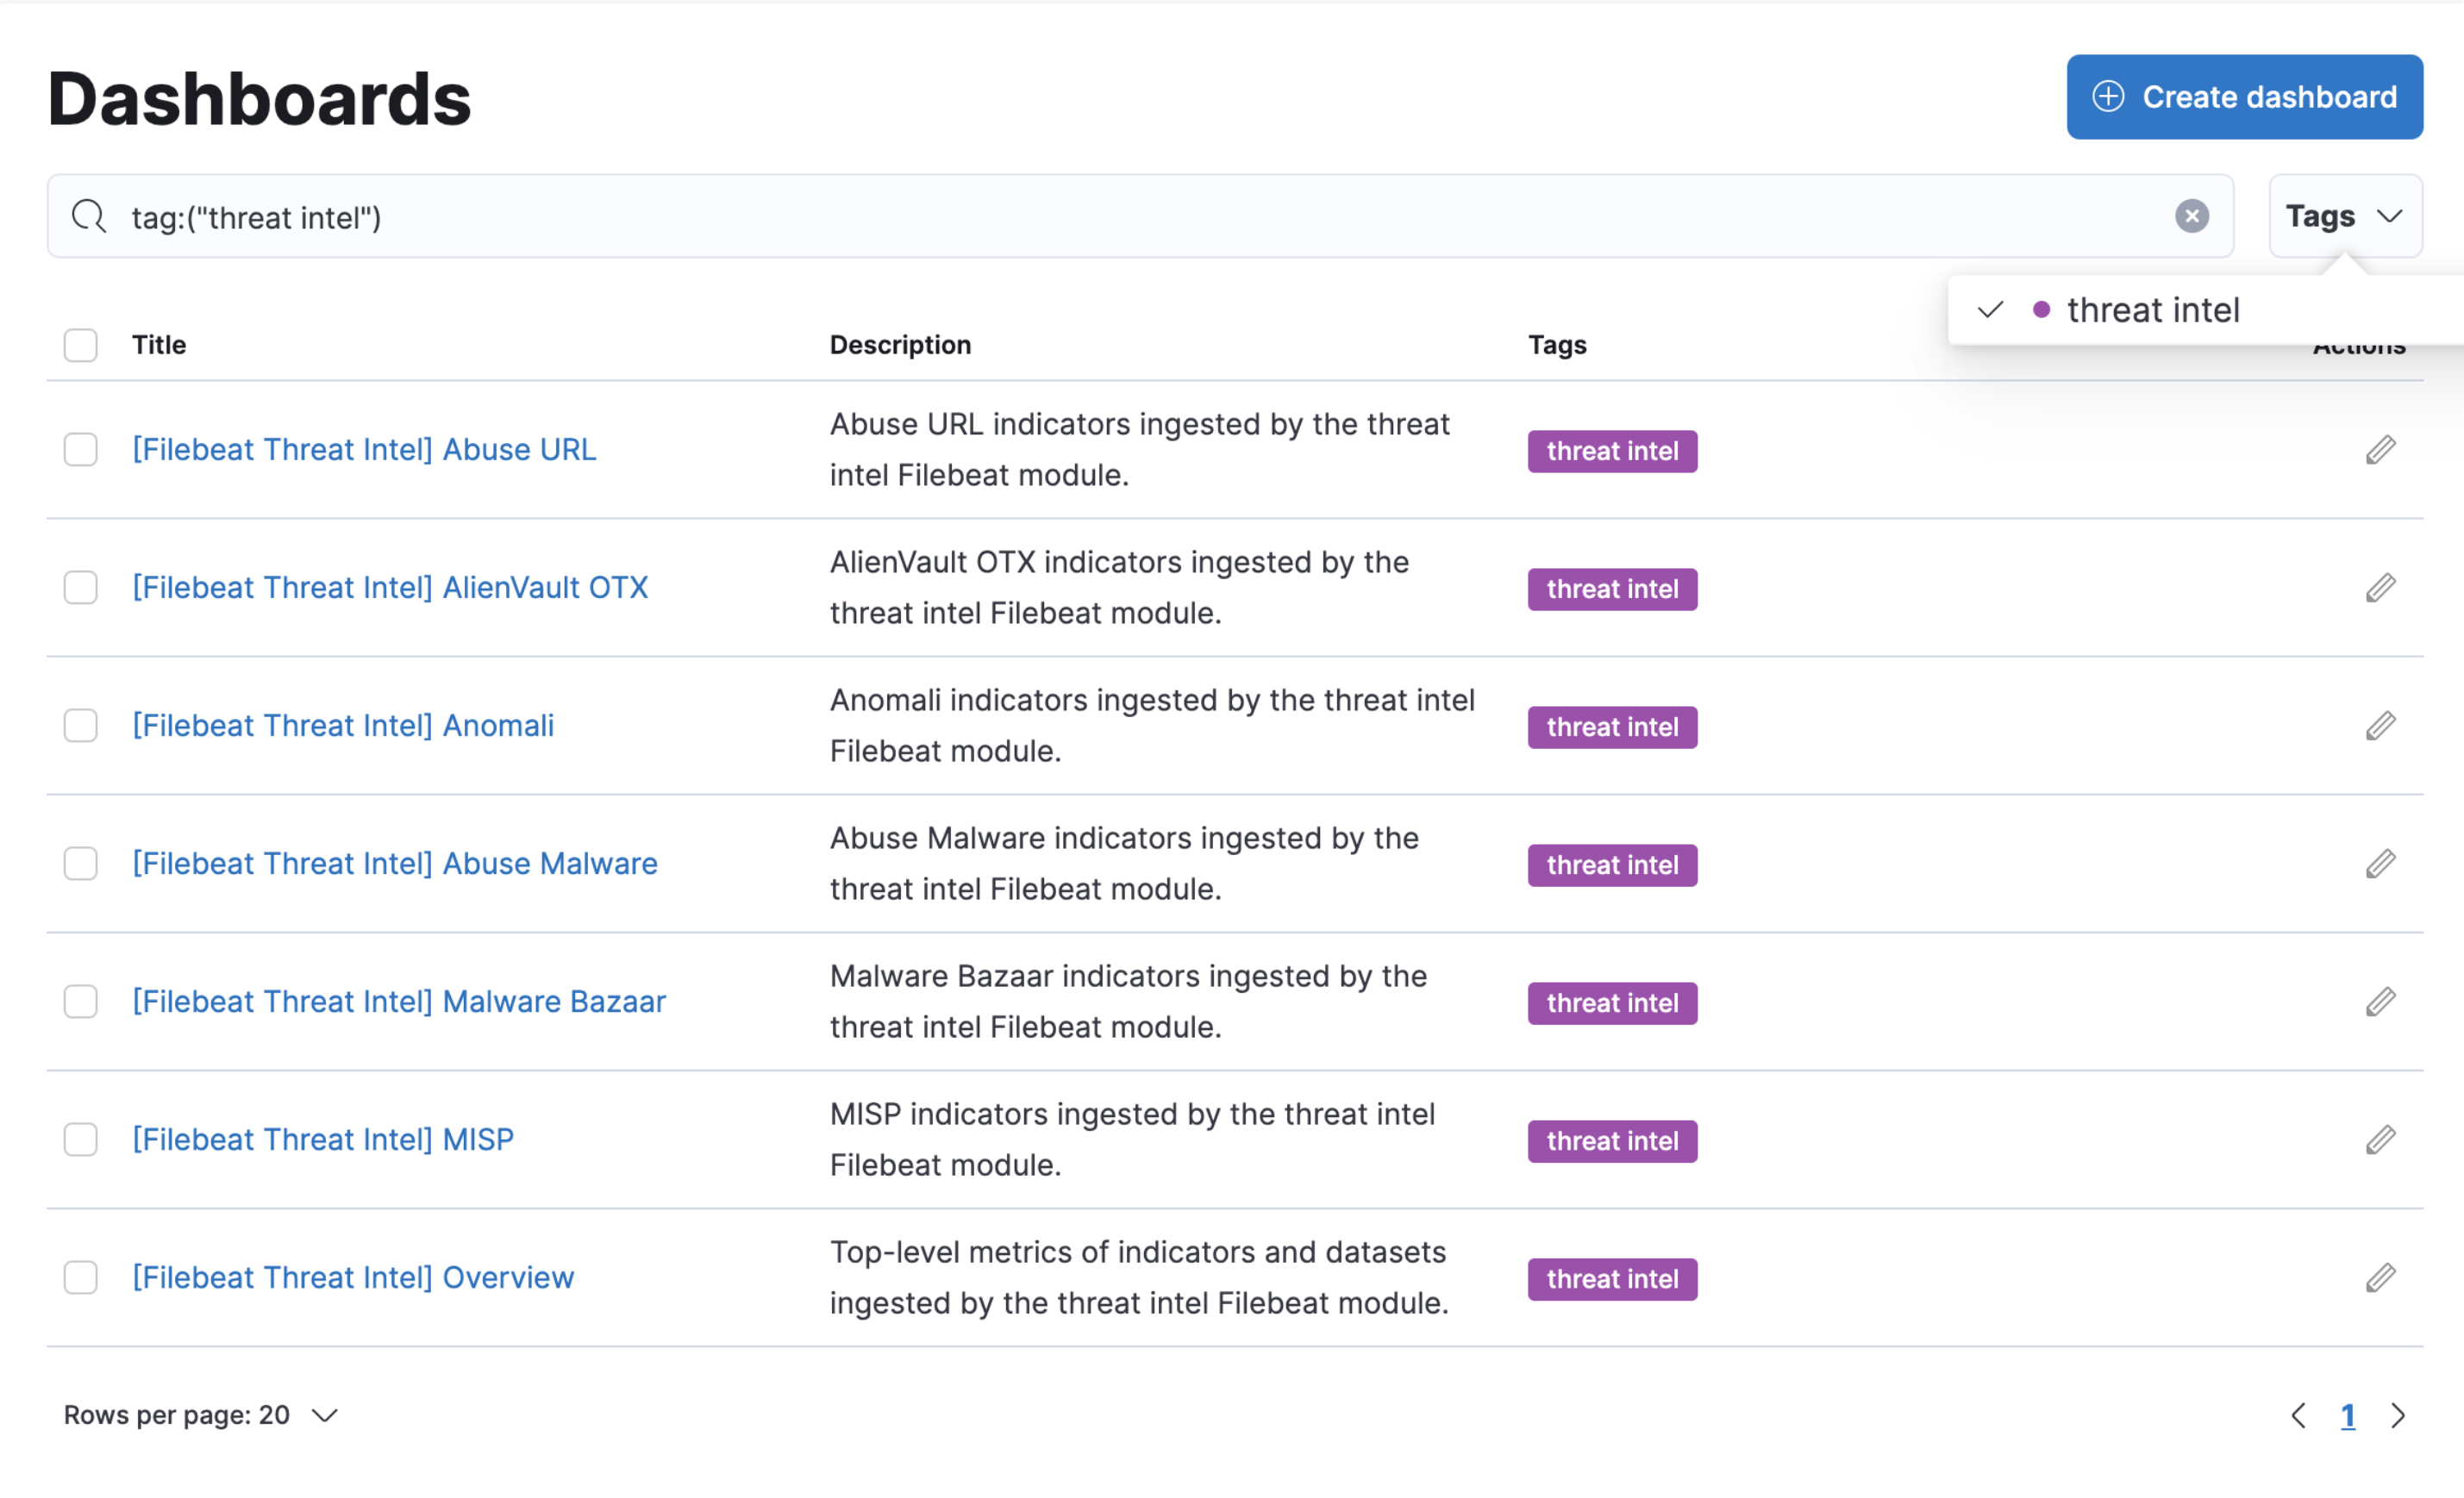
It is also possible to search for threat intelligence dashboards by searching for the “threat intel” tag on the Dashbaords page under the Analyze section of Kibana.
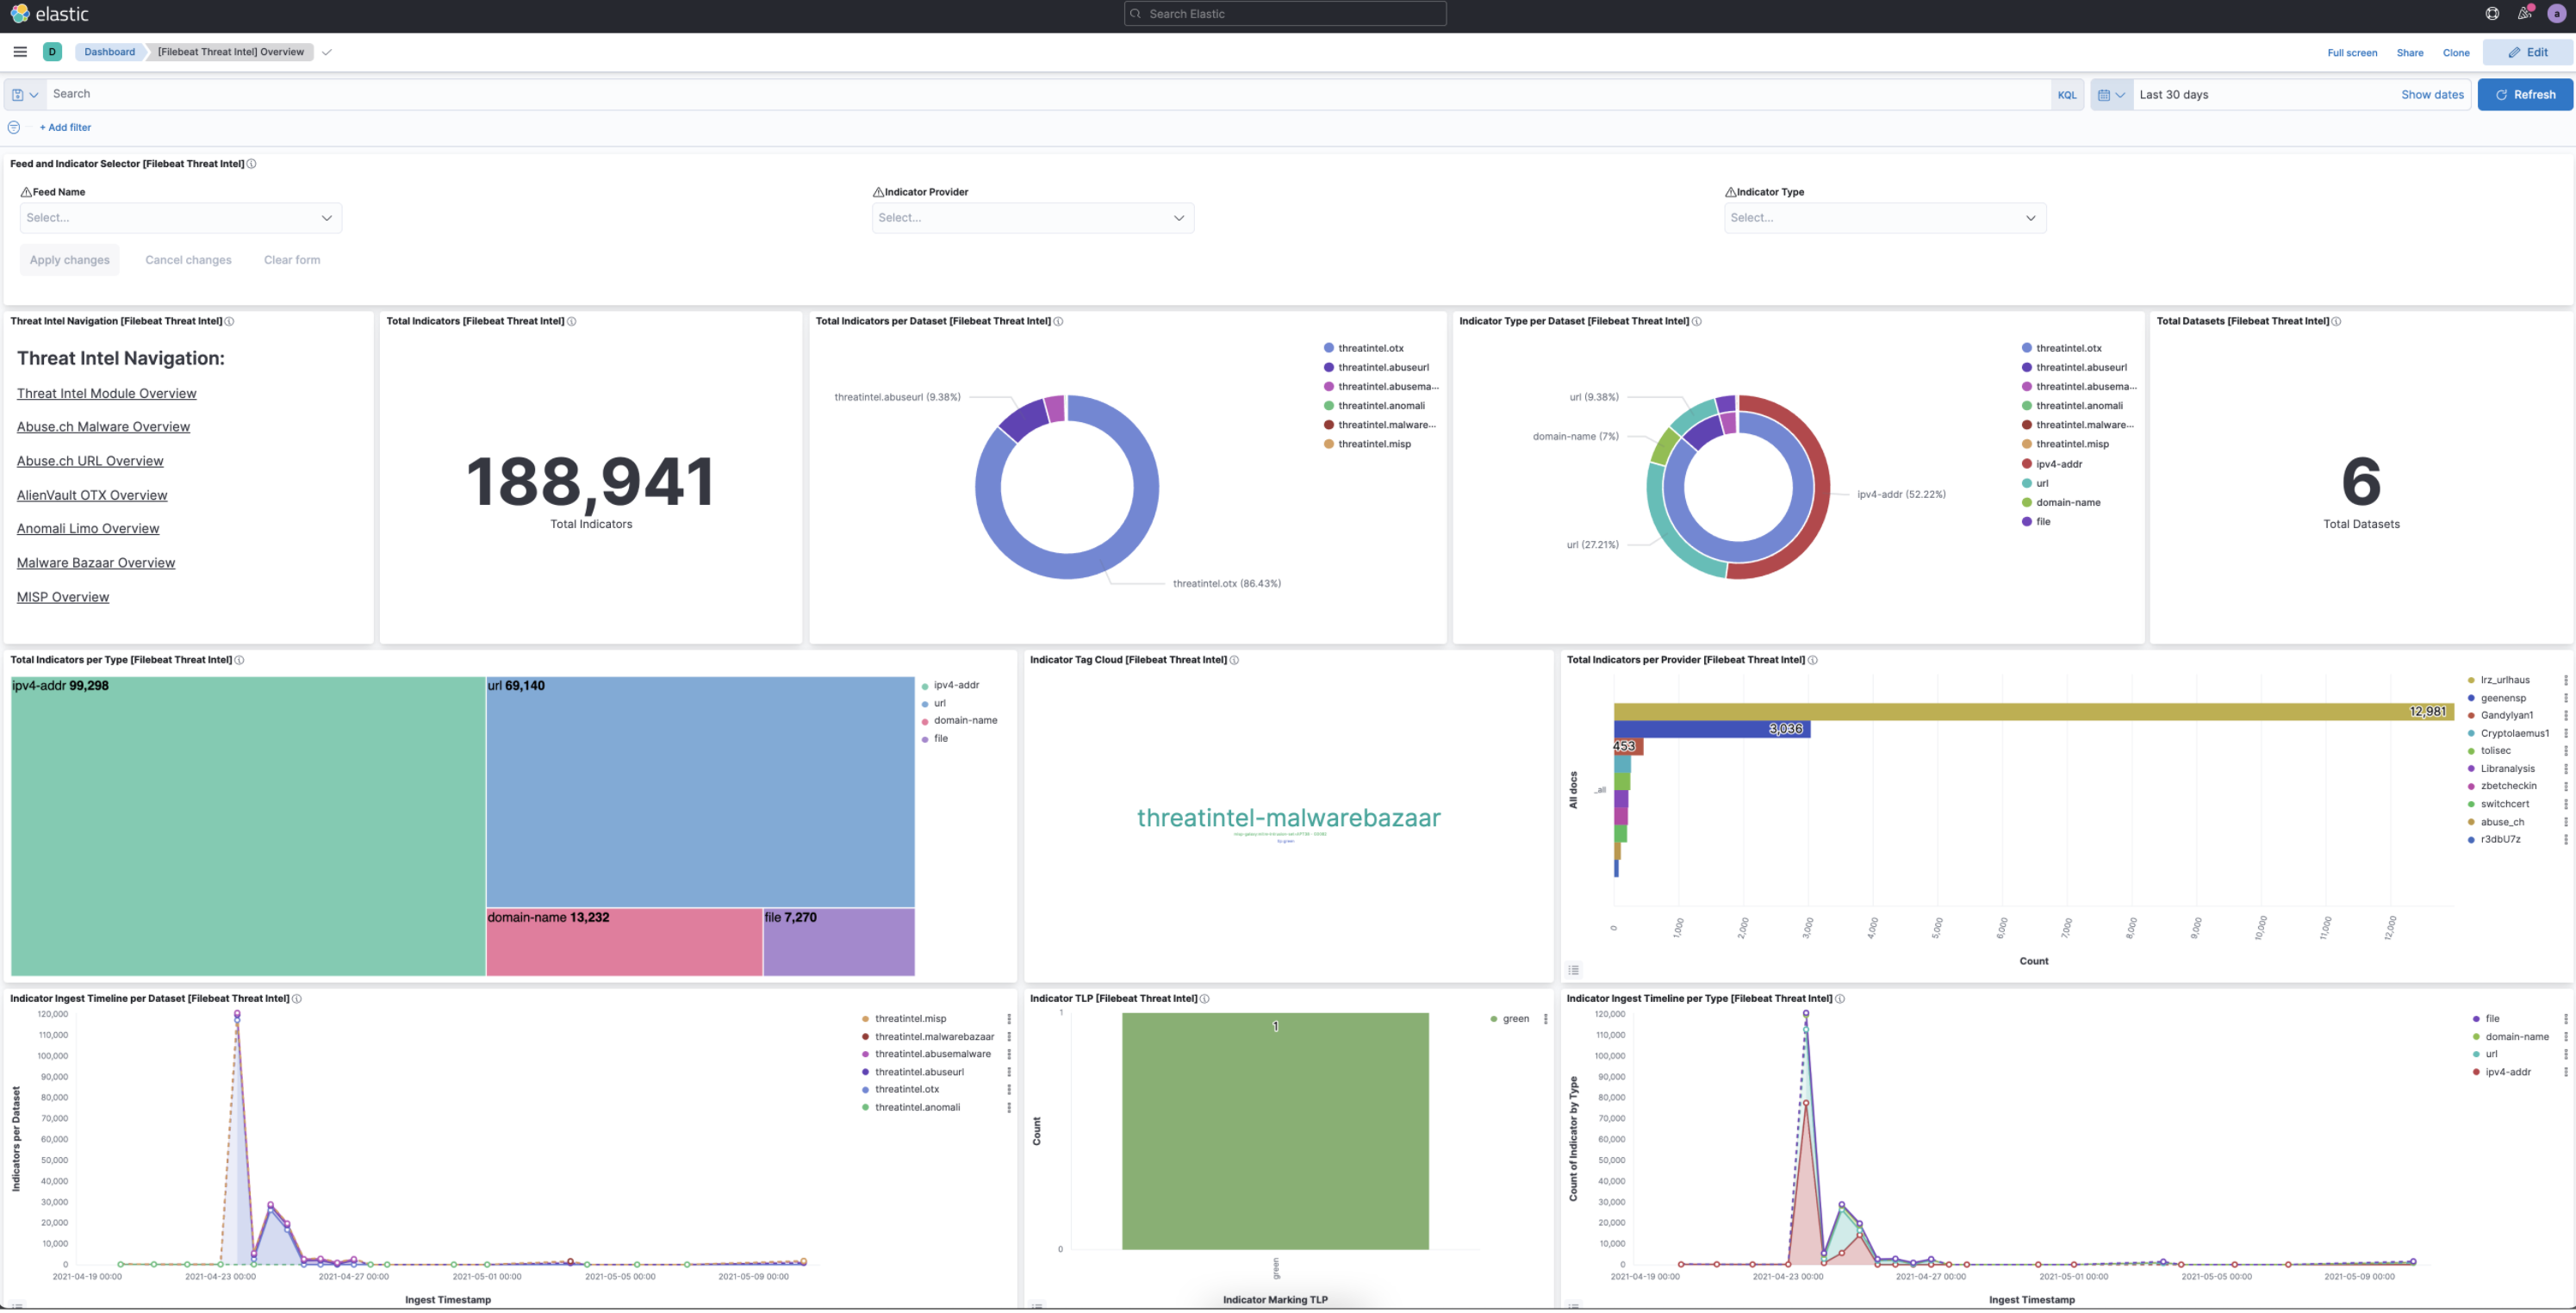
A sample dashboard will have information regarding the status of the indicator index.
CTI row renderer displays relevant threat intelligence information pertaining to an alert when it is viewed on the timeline view. The purpose of the row renderer is to facilitate threat hunting by having the matching threat field and value as well as the threat feed name in a summary view.

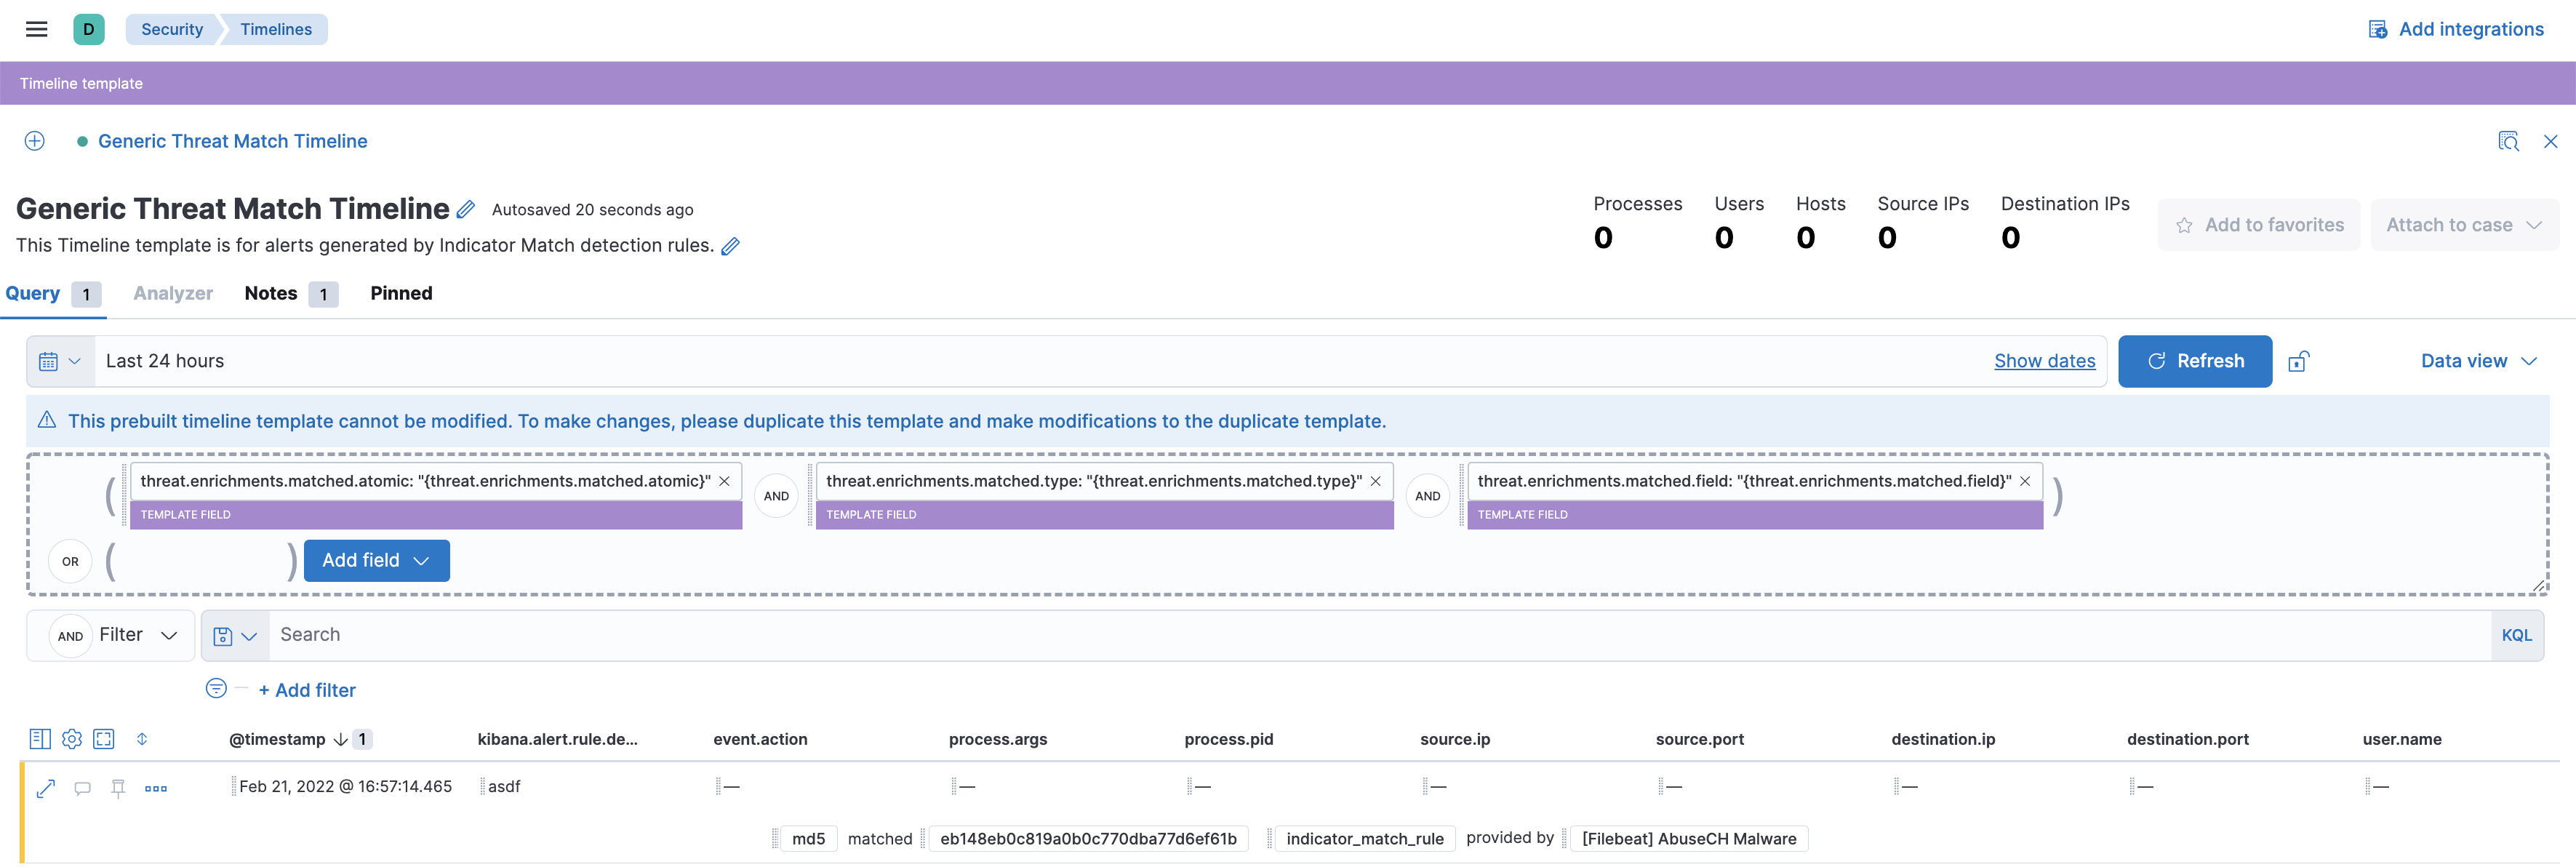
The generic threat match template allows customers to review alerts with threat intelligence data in a simple way for threat hunting purposes.
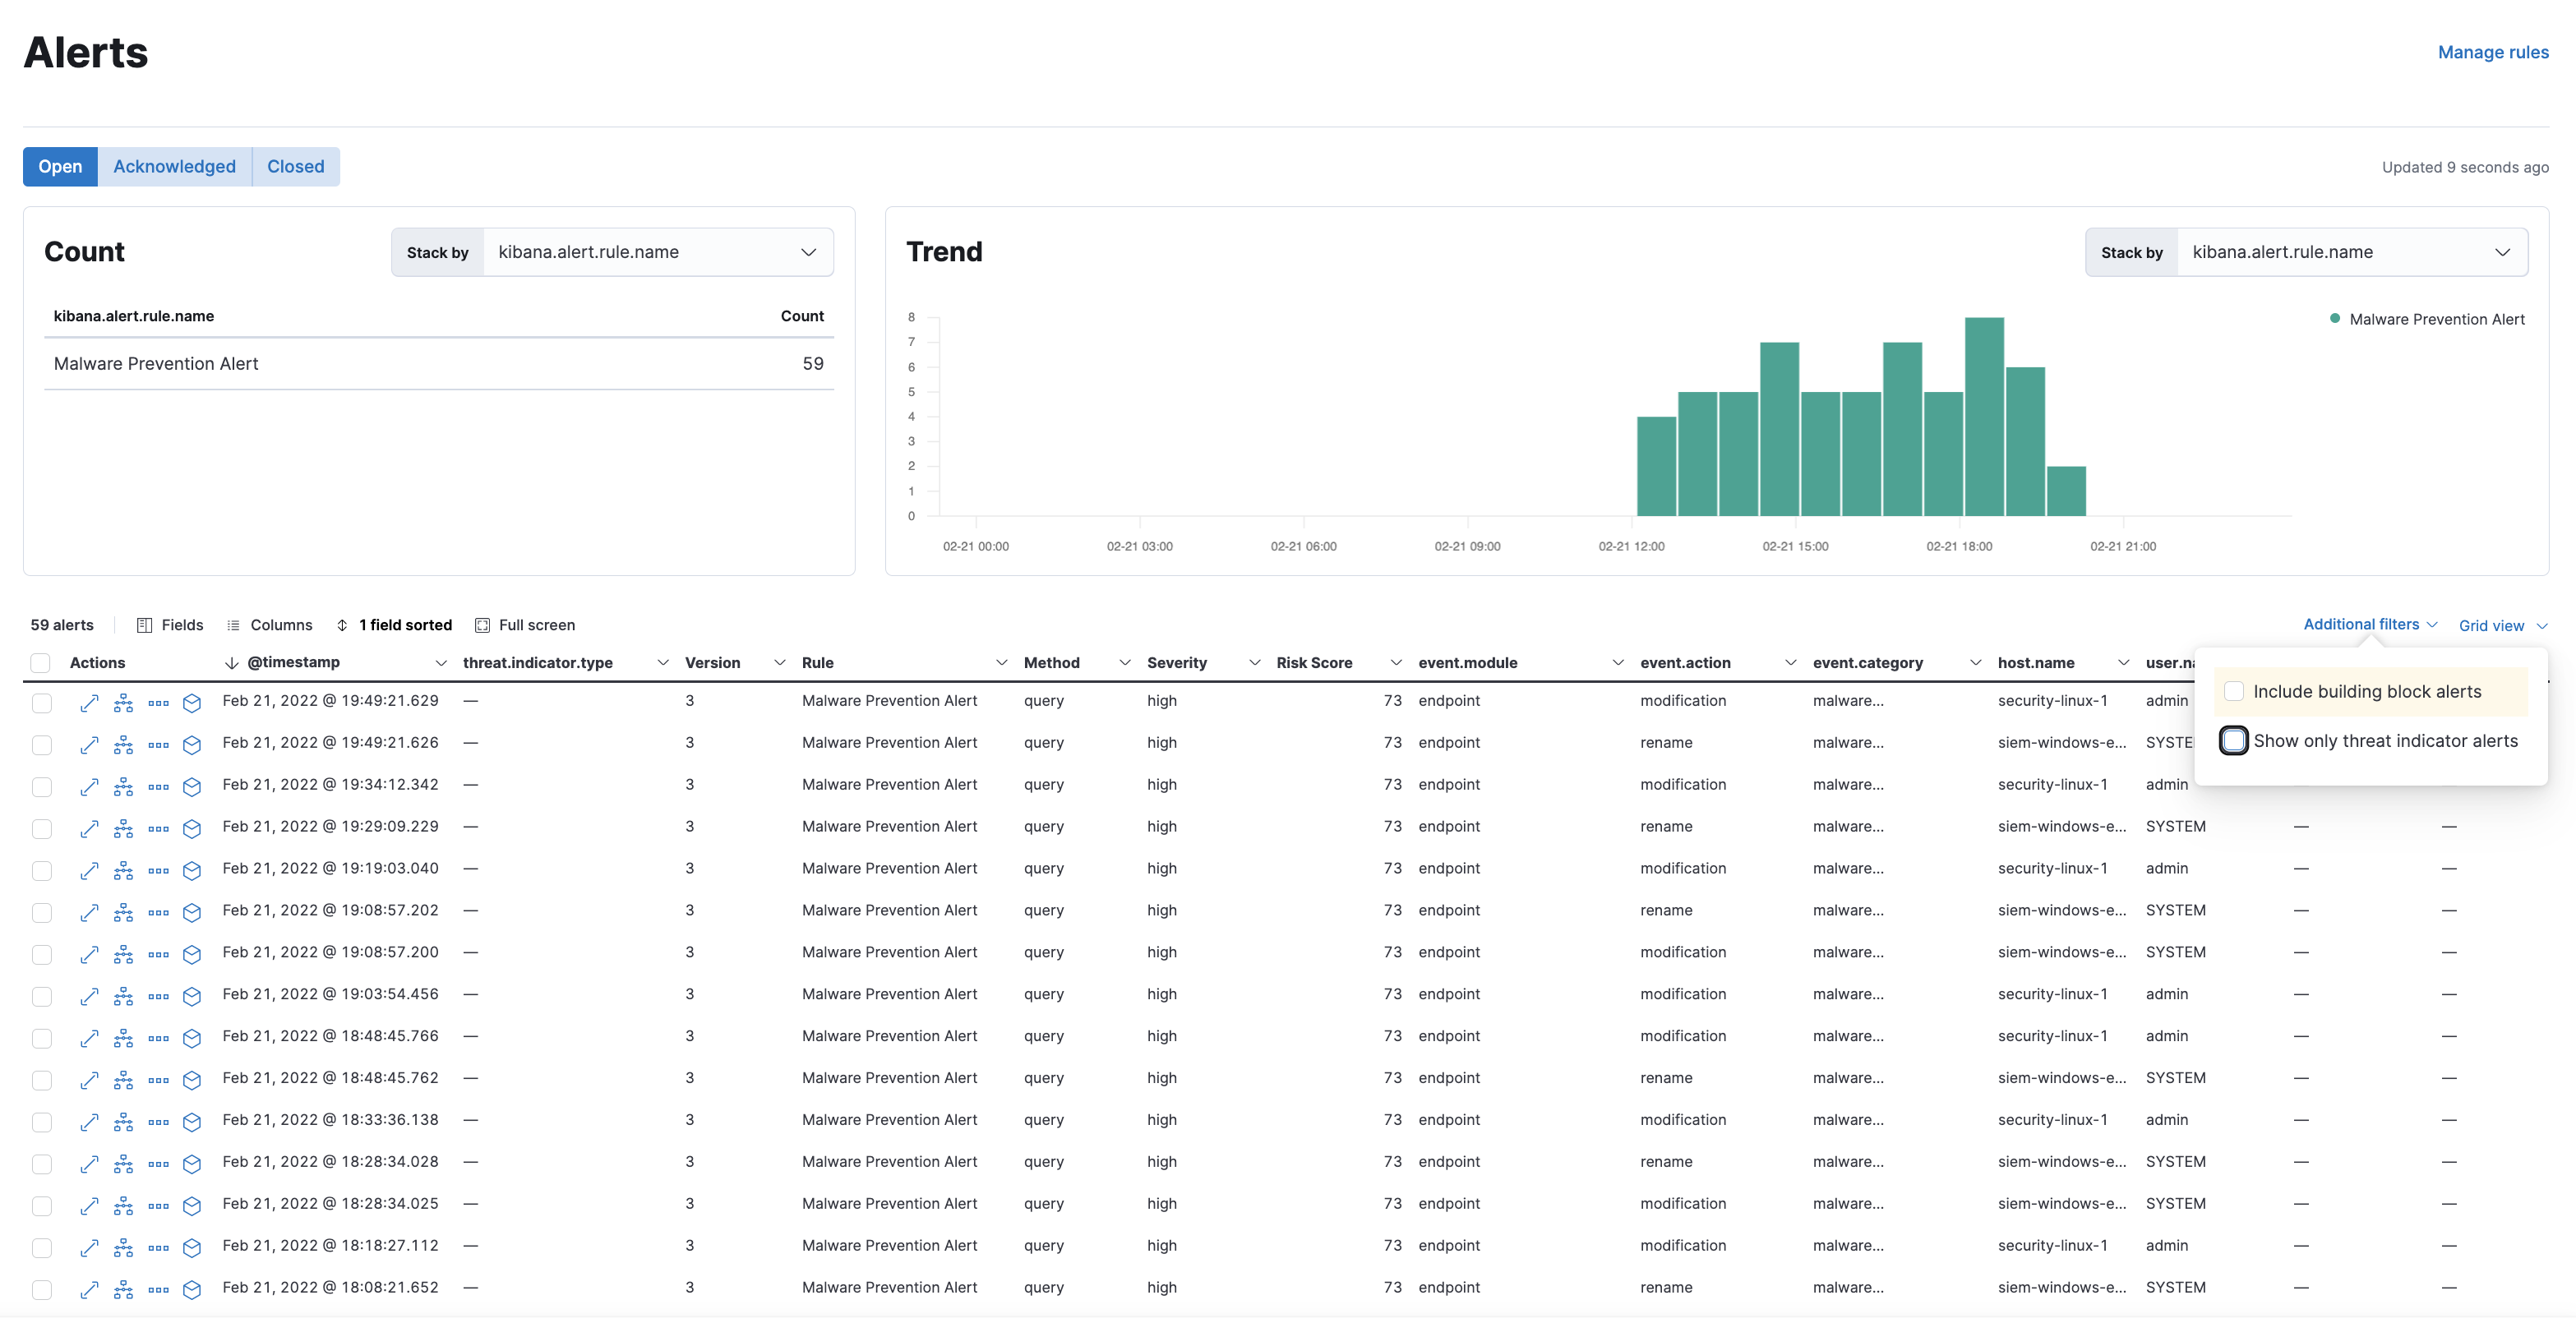
Alerts table can be filtered to display events that contain threat intelligence information by checking the following checkbox on the table UI. Currently this setting only applies to alerts that have persistent threat intelligence information (alerts that have been created by Indicator Match rules). Investigation time enrichments can not be filtered into this view as the search for those is triggered only in Alert Summary Flyout view only.
kibana.dev.yaml
xpack.fleet.agents.enabled: true
xpack.fleet.agents.elasticsearch.host: "http://host.docker.internal:9200"
xpack.fleet.agents.fleet_server.hosts: ["http://host.docker.internal:8220"]
make-build in elastic-packageelastic-package stack update in integrationselastic-package profiles list to see a default profile~/.elastic-package/profiles/default/stack/snapshot.yml to this snippetyarn es snapshot -E xpack.security.authc.api_key.enabled=true -E xpack.security.enabled=true -E indices.id_field_data.enabled=true --license trialstart-kibanaelastic-package stack up -d --services fleet-server,elastic-agent -v --version=8.0.0-SNAPSHOTYou can now install a threat integration using the Integrations UI in Kibana. Once you enable a threat integration and assign the default agent policy, you will see that a logs_ti-* index is created and indicator events are visible in Kibana UI.
example
// beats/x-pack/filebeat/filebeat.yml
output.elasticsearch:
hosts: ["localhost:9200"]
username: "ece"
password: "testtest"

setup.kibana:
host: "localhost:5601"
username: "ece"
password: "testtest"
mage build to build filebeat./filebeat modules enable threatintel and edit modules.d/threatintel.yml to ensure that all values for enabled are true./filebeat setup -E setup.dashboards.directory=build/kibana to setup dashboards (while kibana is running)./filebeat -e to start filebeatYou will now see that a filebeat index is created and indicator events are visible in kibana.
kibana, check out the branch you’d like to test, and run start-bootstrapnode scripts/build_kibana_platform_pluginsnode scripts/functional_tests --config x-pack/test/detection_engine_api_integration/security_and_spaces/config.tsdetection_engine_api_integration directory, go through index.ts file in each subdirectory and comment out the files you’d like to skip.kibana/x-packnode scripts/jest.js and append the directory or file name to run the tests you’d like (such as node scripts/jest.js percolator to run all files in the percolator directory).skip to describe or it blocks to skip suites / specs in the targeted filestesting-library instead of enzyme if you are writing new testskibana/x-pack/plugins/security_solutionyarn cypress:open-as-ci to start the cypress UI
# Elastic aliases
export KIBANA_HOME=$HOME/Workspace/kibana
export PLUGIN_NAME=security_solution
export CASE_PLUGIN_NAME=plugins/case
export NODE_OPTIONS=--max-old-space-size=8192
export filebeat_location=$HOME/go/src/github.com/elastic/beats/x-pack/filebeat
export backport_location=$HOME/.backport/repositories/elastic/kibana

# Start elasticsearch
alias kb-es='cd ${KIBANA_HOME} && yarn es snapshot -E path.data=${KIBANA_HOME}/../data -E xpack.security.authc.api_key.enabled=true --license trial'

# Start kibana
alias start-kibana='cd $KIBANA_HOME && yarn start --no-base-path'

# Start bootstrap
alias start-bootstrap='cd $KIBANA_HOME && yarn kbn bootstrap'

# Start typecheck
alias start-type-check='cd $KIBANA_HOME && node scripts/type_check.js --project x-pack/tsconfig.json'

# Start ftr
alias start-ftr-server='cd ${KIBANA_HOME}/x-pack && node scripts/functional_tests_server.js'
alias start-ftr='cd ${KIBANA_HOME}/x-pack && node scripts/functional_test_runner'

# Start lint
alias start-lint='cd $KIBANA_HOME && node scripts/eslint.js'
alias start-lint-siem='cd $KIBANA_HOME && node scripts/eslint.js x-pack/plugins/$PLUGIN_NAME'
alias start-lint-case='cd $KIBANA_HOME && node scripts/eslint.js x-pack/plugins/case'

# Start unit tests
alias start-jest='cd $KIBANA_HOME/x-pack && node scripts/jest.js $PLUGIN_NAME'
alias start-jest-case='cd $KIBANA_HOME/x-pack && node scripts/jest.js $CASE_PLUGIN_NAME'

# Start unit tests watch
alias start-jest-watch='cd $KIBANA_HOME/x-pack && node scripts/jest.js $PLUGIN_NAME --watch'
alias start-jest-watch-size='cd $KIBANA_HOME/x-pack && node --max-old-space-size=8192 --optimize-for-size  --max_old_space_size=8192 --optimize_for_size scripts/jest.js $PLUGIN_NAME --watch --max_new_space_size=8192'
alias start-jest-watch-case='cd $KIBANA_HOME/x-pack && node scripts/jest.js $CASE_PLUGIN_NAME --watch'

# Start unit tests coverage
alias start-jest-coverage='cd $KIBANA_HOME/x-pack && node scripts/jest.js $PLUGIN_NAME --coverage'
alias start-jest-coverage-case='cd $KIBANA_HOME/x-pack && node scripts/jest.js $CASE_PLUGIN_NAME --coverage'

# Start generation
alias start-bean-gen='cd $KIBANA_HOME/x-pack/plugins/$PLUGIN_NAME && node scripts/generate_types_from_graphql.js'

# Run cyclic dependencies test
alias start-deps-check='cd ${KIBANA_HOME}/x-pack/plugins/${PLUGIN_NAME} && node scripts/check_circular_deps.js'

# Start api integration tests
alias start-integration='cd $KIBANA_HOME && node scripts/functional_tests --config x-pack/test/api_integration/config.js'

# Start cypress open
alias start-cypress-open='cd $KIBANA_HOME/x-pack/plugins/$PLUGIN_NAME && yarn cypress:open'

# Start cypress run
alias start-cypress-run='cd $KIBANA_HOME/x-pack/plugins/$PLUGIN_NAME && yarn cypress:run'

# Start cypress ci
alias start-cypress-ci='cd $KIBANA_HOME/x-pack/plugins/$PLUGIN_NAME && yarn cypress:run-as-ci'

# Test all
alias start-test-all='start-bean-gen && start-i18n-check && start-type-check && start-lint && start-lint-case && start-jest && start-jest-case'

# Start a translation check
alias start-i18n-check='cd $KIBANA_HOME && node scripts/i18n_check --ignore-missing'

# Backport alias
alias start-backport='cd $KIBANA_HOME && node scripts/backport'

# Delete node_modules and caches
alias start-burn-the-world='cd $KIBANA_HOME && git clean -fdx -e \.idea\/ -e config\/ && rm -rf node_modules && yarn cache clean'

# Sync kibana
alias sync-kibana='cd $KIBANA_HOME && git checkout main && git fetch upstream && git merge upstream/main && git push origin main'

# Branch Update with Upstream master
alias bru='git fetch upstream && git pull -r upstream main && git status'
Possible issues that have been observed before can be grouped in the following categories:
This usually manifests as a rule failure: Bulk Indexing of signals failed: [parent] Data too large, indicating that the alerts payload was simply too large to process. This could be caused by anything upstream of the alert generation: bad/greedy indicator data, a misconfigured rule, or simply too many events/matches. If nothing obvious is misconfigured, try executing the rule against a subset of the original data and continue diagnosis.
This occurs as another rule failure: An error occurred during rule execution: message: "Request Timeout after 90000ms" and indicates that the query phase is timing out. Similar to the above, inspect the time frame and indices that this rule(s) is querying and try to limit this, or break into multiple rules, etc. See also the General Guidelines below.
Due to the amount of in-memory work that indicator match rules perform, having a large number of rules running in parallel can cause noticeable performance implications to kibana.
Since the number of indicators directly relates to the amount of work to be performed, filtering out unnecessary indicators is a quick way to improve performance. This can most easily be done with the indicator query (rule parameter: threat_query). If, for example, your indicator indices contain two types of data, but your rule is only concerned with one of them, a threat query of threat.indicator.dataset: “my_dataset” will reduce the number of indicators that must be iterated through.
Similar to the above, narrowing the query (rule parameter: query) of your source indices may also improve performance. If, as above, your mapping includes source.port -> threat.indicator.port, defining a query of source_port: * can help ensure that irrelevant documents are not included in the search.
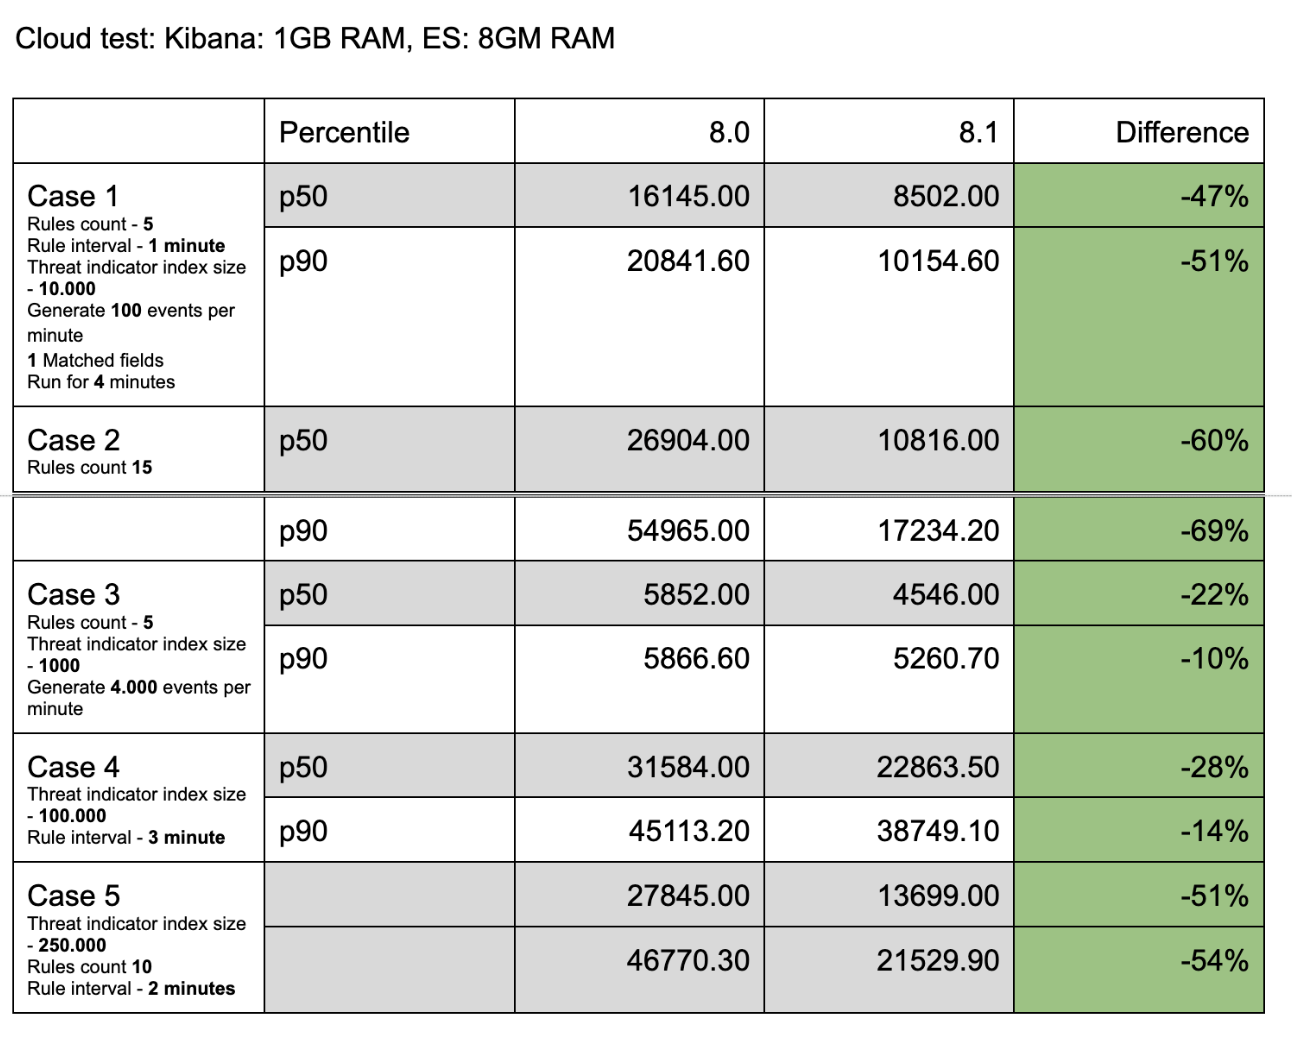
kbn-alert-load is a library for load testing the alerting framework. It is also useful for establishing performance benchmarks for the Indicator Match rule. Multiple test cases have been created for measuring the indicator match rule performance.
| name | rule count | rule interval | indicator count | event count per minute | matched field count | runtime |
|---|---|---|---|---|---|---|
| Case 1 | 5 | 1m | 10k | 100 | 1 | 4m |
| Case 2 | 15 | 1m | 10k | 100 | 1 | 4m |
| Case 3 | 5 | 1m | 1k | 4k | 1 | 4m |
| Case 4 | 5 | 1m | 100k | 100 | 3 | 4m |
| Case 5 | 10 | 1m | 250k | 100 | 1 | 2m |
The following are the results comparing the 8.0 and 8.1 branches to one another according to the cases outlined above.
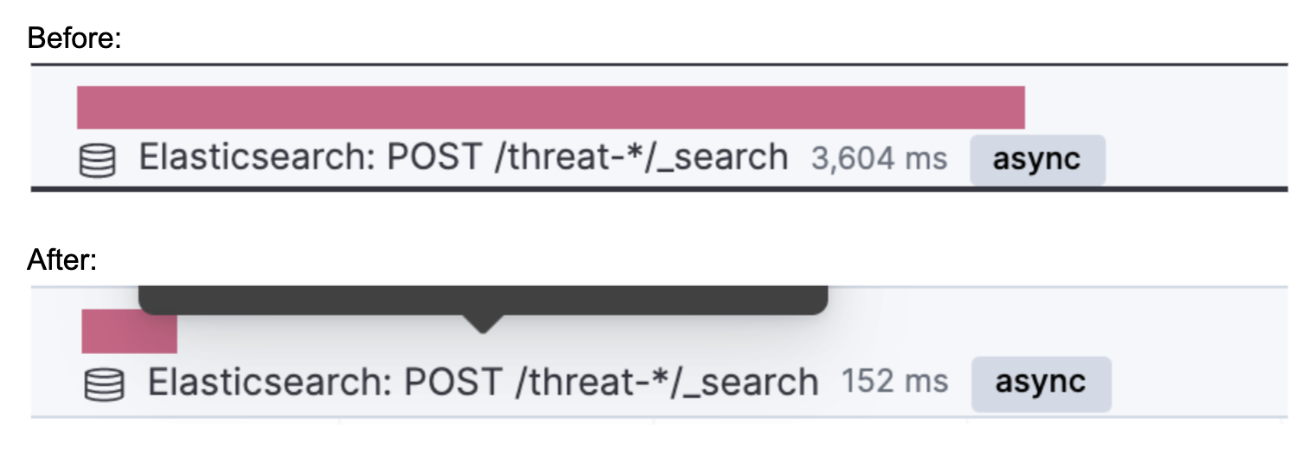
APM is helpful for monitoring the CPU and memory usage while the Indicator Match rules are running, and it provides an important supporting metric to results obtained by kbn-alert-load.
Individual requests can also be observed with APM. The following is the difference between the execution time of an individual query made to the threat index to obtain indicators.
PUT test-index
@timestamp fieldPUT test-index/_mapping
{
"properties": {
"@timestamp": {
"type": "date"
}
}
}
new Date().valueOf()
1645547413852) and make the following request to create a source event.
Note: in this example, a field named test-field is added to the event. Indicator Match rules work with all events, but ECS compliant fields are recommended for use.POST test-index/_doc
{
"@timestamp": 1645547413852,
"test-field": "test-value"
}
@timestamp field.PUT threat-index
PUT threat-index/_mapping
{
"properties": {
"@timestamp": {
"type": "date"
}
}
}
PUT threat-index/_doc
{
"@timestamp": 1645547413852,
"threat-field": "test-value"
}
test-index as the index value, threat-index as the threat index value.test-field to index field, and threat-field to indicator field to create the threat mapping.PUT test-index
@timestamp fieldPUT test-index/_mapping
{
"properties": {
"@timestamp": {
"type": "date"
}
}
}
new Date().valueOf()
1645547413852) and make the following request to create a source event. Make sure to include a field that is suitable for investigation time enrichments.
Note: in this example, file.hash.md5 is used for creating the investigation time enrichment. Also, a field named test-field is added to the event. Indicator Match rules work with all events, but ECS compliant fields are recommended for use.POST test-index/_doc
{
"@timestamp": 1645547413852,
"test-field": "test-value",
"file": {
"hash: {
"md5": "test-md5"
}
}
}
@timestamp field, and add the value requied for the investigation time enrichment (in this example, threat.indicator.file.hash.md5)PUT threat-index
PUT threat-index/_mapping
{
"properties": {
"@timestamp": {
"type": "date"
}
}
}
PUT threat-index/_doc
{
"@timestamp": 1645547413852,
"threat": {
"indicator": {
"file": {
"hash": {
"md5": "test-md5"
}
}
}
}
}
threat-index to defaultThreatIndex UI setting in Stack Management / Advanced Settingstest-index and query test-field:*file.hash.md5 field on the Overview tab and the Threat Intel tab.Source link on the CTI Card for the dashboard you would like to viewthreat intel tag to find any threat intel dashboards.Generic Threat Match Template to view and use the threat match template.